29
/it/
it
AIzaSyAYiBZKx7MnpbEhh9jyipgxe19OcubqV5w
April 1, 2024
167055
Kenya
KEN
true
2
1
Adjusted net savings, including particulate emission damage (current US$)
2015,2014,2013,2012,2011,2010,2009,2008,2007,2006,2005,2004,2003,2002,2001,2000,1999,1998,1997,1996,1995,1994,1993,1992,1991
Queste statistiche in altri paesi:
AfghanistanAlbaniaAlgeriaAngolaArgentinaArmeniaAustraliaAustriaAzerbaijanBahamas, TheBahrainBangladeshBarbadosBelarusBelgiumBelizeBeninBhutanBoliviaBotswanaBrazilBrunei DarussalamBulgariaBurkina FasoBurundiCabo VerdeCambodiaCameroonCanadaCentral African RepublicChadChileChinaColombiaComorosCongo, Dem. Rep.Congo, Rep.Costa RicaCote d'IvoireCroatiaCyprusCzech RepublicDenmarkDominican RepublicEcuadorEgypt, Arab Rep.El SalvadorEquatorial GuineaEritreaEstoniaEthiopiaFijiFinlandFranceGabonGambia, TheGeorgiaGermanyGhanaGreeceGuatemalaGuineaGuinea-BissauGuyanaHaitiHondurasHungaryIcelandIndiaIndonesiaIran, Islamic Rep.IraqIrelandIsraelItalyJamaicaJapanJordanKazakhstanKenyaKorea, Rep.KuwaitKyrgyz RepublicLao PDRLatviaLebanonLesothoLiberiaLibyaLithuaniaLuxembourgMacedonia, FYRMadagascarMalawiMalaysiaMaldivesMaliMauritaniaMauritiusMexicoMoldovaMongoliaMoroccoMozambiqueNamibiaNepalNetherlandsNew ZealandNicaraguaNigerNigeriaNorwayOmanPakistanPanamaPapua New GuineaParaguayPeruPhilippinesPolandPortugalQatarRomaniaRussian FederationRwandaSaudi ArabiaSenegalSierra LeoneSingaporeSlovak RepublicSloveniaSolomon IslandsSouth AfricaSpainSri LankaSudanSurinameSwazilandSwedenSwitzerlandSyrian Arab RepublicTajikistanTanzaniaThailandTogoTrinidad and TobagoTunisiaTurkeyUgandaUkraineUnited KingdomUnited StatesUruguayVenezuela, RBVietnamYemen, Rep.ZambiaZimbabwe Linea del tempo:
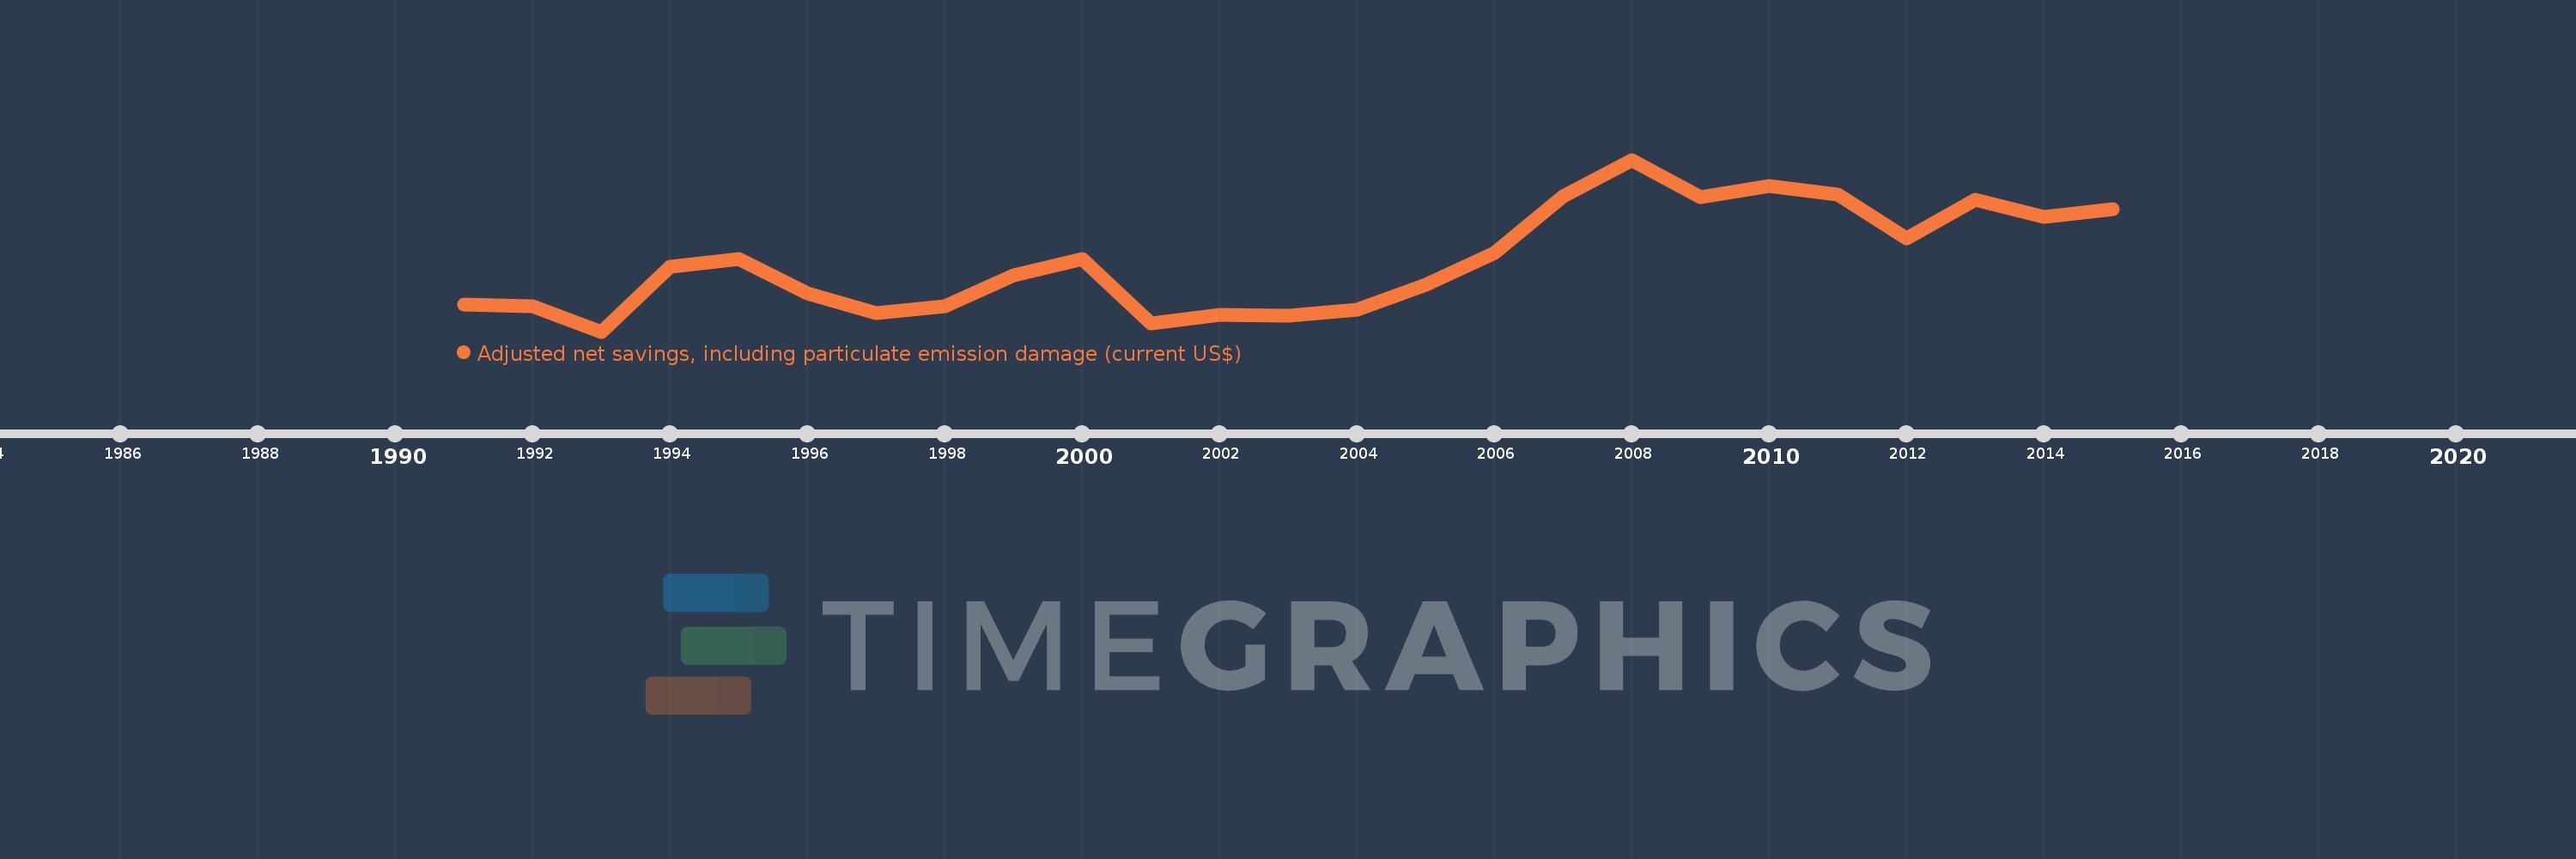
Questa scala temporale mostra un grafico dal 1991 anno al 2015 anno. Kenya. I dati fino ad 1990 anno non disponibili. Il numero di osservazioni attuali secondo i date: 25.
La fonte (nome):
Indicatori dello sviluppo mondiale
La fonte (organizzazione):
World Bank staff estimates based on sources and methods in World Bank's "The Changing Wealth of Nations: Measuring Sustainable Development in the New Millennium" (2011).
Categorie:
Economy & Growth, Environment
sono stati aggiornati
23 apr 2017 anni
Indicatori delle variazioni dei valori per anni
Minima:
321.798 Mln
1 gen 1993 anni
Massimo:
3.239 Mlrd
1 gen 2008 anni
Alla data di osservazione
Valore
Variazione assoluta
La variazione rispetto al valore precedente
1 gen 1991 anni
780.891 Mln
+780.891 Mln
0.0%
1 gen 1992 anni
749.23 Mln
-31.661 Mln
-4.05%
1 gen 1993 anni
321.798 Mln
-427.432 Mln
-57.05%
1 gen 1994 anni
1.43 Mlrd
+1.108 Mlrd
344.33%
1 gen 1995 anni
1.549 Mlrd
+118.784 Mln
8.31%
1 gen 1996 anni
973.605 Mln
-575.019 Mln
-37.13%
1 gen 1997 anni
629.416 Mln
-344.19 Mln
-35.35%
1 gen 1998 anni
757.48 Mln
+128.064 Mln
20.35%
1 gen 1999 anni
1.277 Mlrd
+519.771 Mln
68.62%
1 gen 2000 anni
1.552 Mlrd
+274.583 Mln
21.5%
1 gen 2001 anni
466.447 Mln
-1.085 Mlrd
-69.94%
1 gen 2002 anni
607.952 Mln
+141.506 Mln
30.34%
1 gen 2003 anni
593.64 Mln
-14.312 Mln
-2.35%
1 gen 2004 anni
692.355 Mln
+98.714 Mln
16.63%
1 gen 2005 anni
1.115 Mlrd
+422.807 Mln
61.07%
1 gen 2006 anni
1.659 Mlrd
+543.484 Mln
48.74%
1 gen 2007 anni
2.624 Mlrd
+965.8 Mln
58.23%
1 gen 2008 anni
3.239 Mlrd
+614.482 Mln
23.41%
1 gen 2009 anni
2.61 Mlrd
-628.714 Mln
-19.41%
1 gen 2010 anni
2.788 Mlrd
+177.315 Mln
6.79%
1 gen 2011 anni
2.643 Mlrd
-144.557 Mln
-5.19%
1 gen 2012 anni
1.899 Mlrd
-744.404 Mln
-28.17%
1 gen 2013 anni
2.565 Mlrd
+666.258 Mln
35.09%
1 gen 2014 anni
2.271 Mlrd
-293.448 Mln
-11.44%
1 gen 2015 anni
2.402 Mlrd
+131.061 Mln
5.77%
Classificazione dei paesi secondo i statistiche attuali per anni


Commenti: