29
/it/
it
AIzaSyAYiBZKx7MnpbEhh9jyipgxe19OcubqV5w
April 1, 2024
254823
Swaziland
SWZ
true
2
1
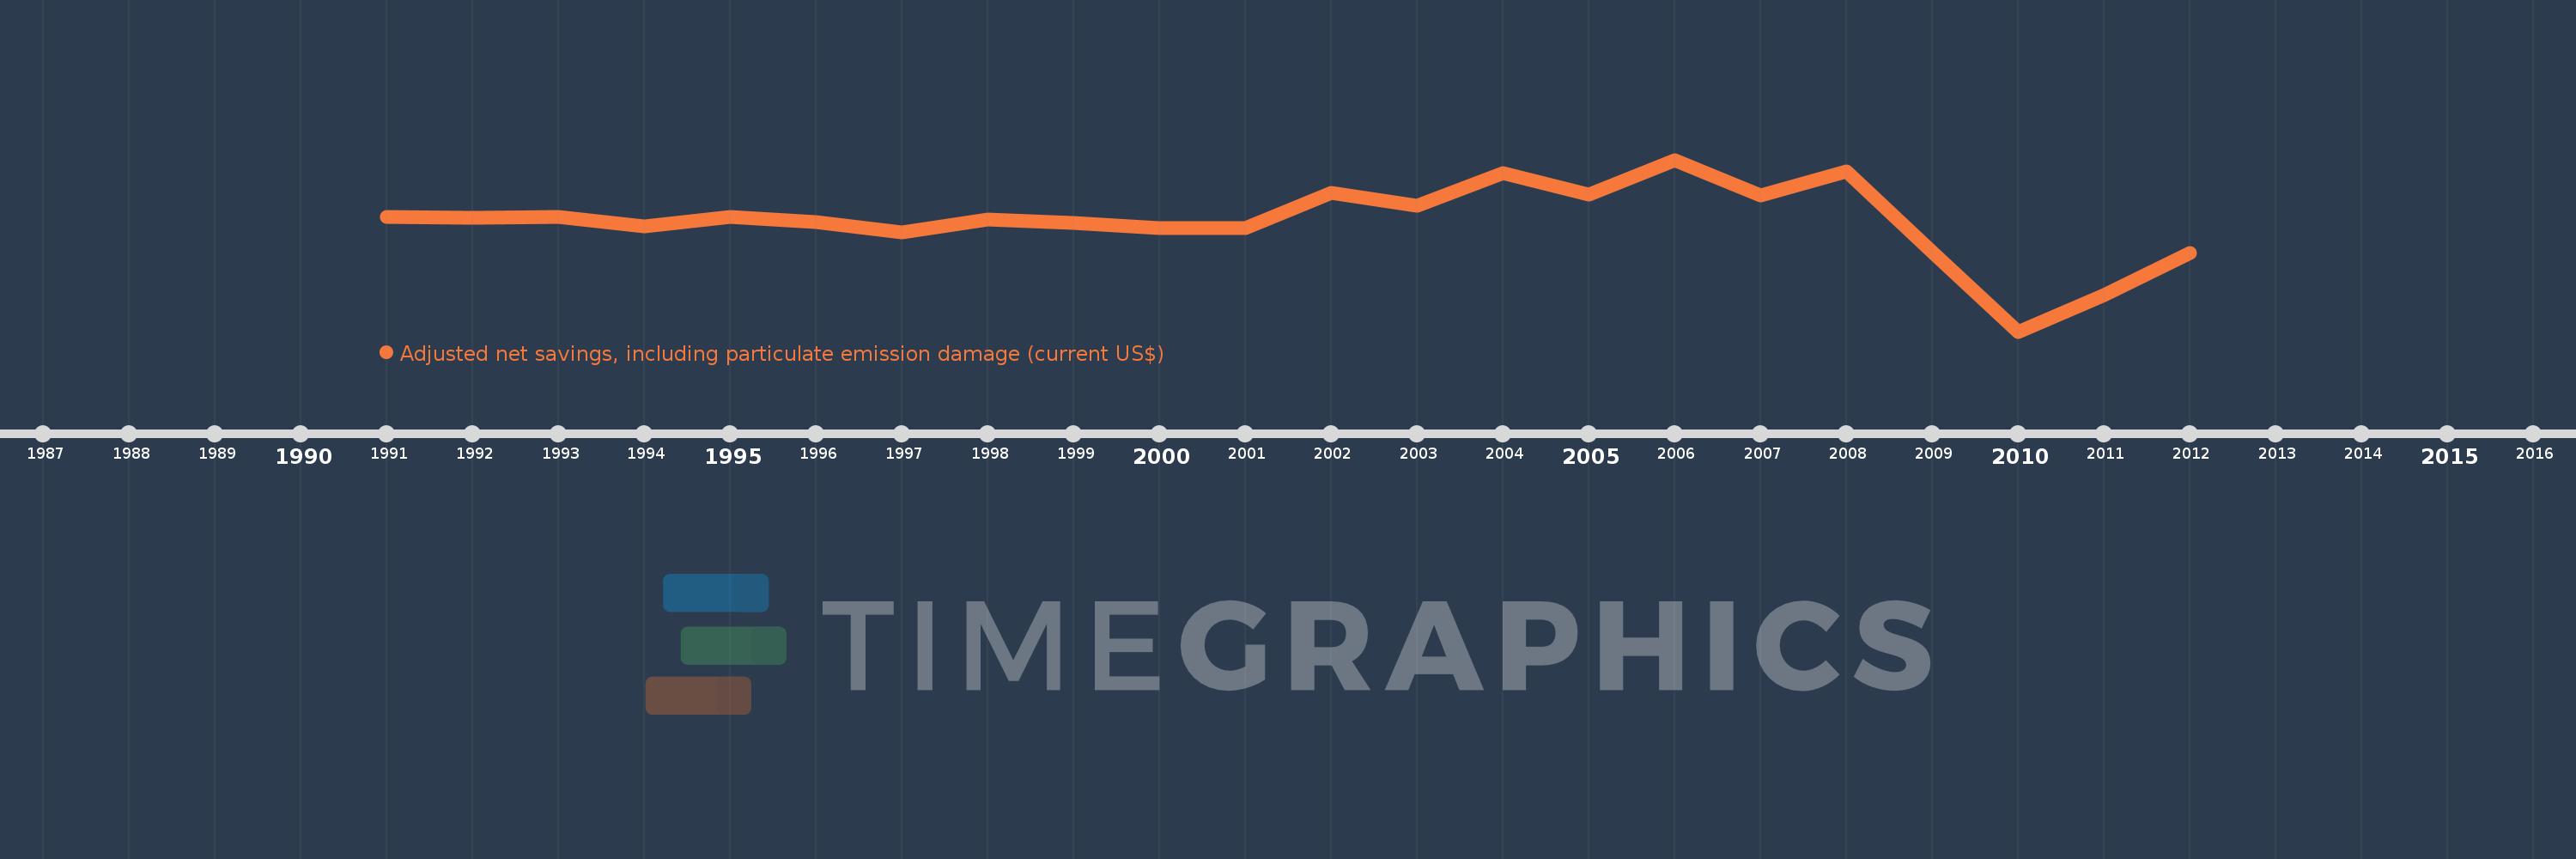
Adjusted net savings, including particulate emission damage (current US$)
2012,2011,2010,2009,2008,2007,2006,2005,2004,2003,2002,2001,2000,1999,1998,1997,1996,1995,1994,1993,1992,1991
Queste statistiche in altri paesi:
AfghanistanAlbaniaAlgeriaAngolaArgentinaArmeniaAustraliaAustriaAzerbaijanBahamas, TheBahrainBangladeshBarbadosBelarusBelgiumBelizeBeninBhutanBoliviaBotswanaBrazilBrunei DarussalamBulgariaBurkina FasoBurundiCabo VerdeCambodiaCameroonCanadaCentral African RepublicChadChileChinaColombiaComorosCongo, Dem. Rep.Congo, Rep.Costa RicaCote d'IvoireCroatiaCyprusCzech RepublicDenmarkDominican RepublicEcuadorEgypt, Arab Rep.El SalvadorEquatorial GuineaEritreaEstoniaEthiopiaFijiFinlandFranceGabonGambia, TheGeorgiaGermanyGhanaGreeceGuatemalaGuineaGuinea-BissauGuyanaHaitiHondurasHungaryIcelandIndiaIndonesiaIran, Islamic Rep.IraqIrelandIsraelItalyJamaicaJapanJordanKazakhstanKenyaKorea, Rep.KuwaitKyrgyz RepublicLao PDRLatviaLebanonLesothoLiberiaLibyaLithuaniaLuxembourgMacedonia, FYRMadagascarMalawiMalaysiaMaldivesMaliMauritaniaMauritiusMexicoMoldovaMongoliaMoroccoMozambiqueNamibiaNepalNetherlandsNew ZealandNicaraguaNigerNigeriaNorwayOmanPakistanPanamaPapua New GuineaParaguayPeruPhilippinesPolandPortugalQatarRomaniaRussian FederationRwandaSaudi ArabiaSenegalSierra LeoneSingaporeSlovak RepublicSloveniaSolomon IslandsSouth AfricaSpainSri LankaSudanSurinameSwazilandSwedenSwitzerlandSyrian Arab RepublicTajikistanTanzaniaThailandTogoTrinidad and TobagoTunisiaTurkeyUgandaUkraineUnited KingdomUnited StatesUruguayVenezuela, RBVietnamYemen, Rep.ZambiaZimbabwe Linea del tempo:
Questa scala temporale mostra un grafico dal 1991 anno al 2012 anno. Swaziland. I dati fino ad 1990 anno non disponibili. Il numero di osservazioni attuali secondo i date: 22.
La fonte (nome):
Indicatori dello sviluppo mondiale
La fonte (organizzazione):
World Bank staff estimates based on sources and methods in World Bank's "The Changing Wealth of Nations: Measuring Sustainable Development in the New Millennium" (2011).
Categorie:
Economy & Growth, Environment
sono stati aggiornati
23 apr 2017 anni
Indicatori delle variazioni dei valori per anni
Minima:
-394.901 Mln
1 gen 2010 anni
Massimo:
296.239 Mln
1 gen 2006 anni
Alla data di osservazione
Valore
Variazione assoluta
La variazione rispetto al valore precedente
1 gen 1991 anni
67.098 Mln
+67.098 Mln
0.0%
1 gen 1992 anni
64.367 Mln
-2.731 Mln
-4.07%
1 gen 1993 anni
65.095 Mln
+728.345 Mille.
1.13%
1 gen 1994 anni
28.915 Mln
-36.18 Mln
-55.58%
1 gen 1995 anni
65.331 Mln
+36.415 Mln
125.94%
1 gen 1996 anni
47.064 Mln
-18.266 Mln
-27.96%
1 gen 1997 anni
4.579 Mln
-42.485 Mln
-90.27%
1 gen 1998 anni
56.98 Mln
+52.401 Mln
1.14 Mille.%
1 gen 1999 anni
41.201 Mln
-15.779 Mln
-27.69%
1 gen 2000 anni
20.528 Mln
-20.674 Mln
-50.18%
1 gen 2001 anni
22.41 Mln
+1.882 Mln
9.17%
1 gen 2002 anni
162.341 Mln
+139.931 Mln
624.41%
1 gen 2003 anni
110.552 Mln
-51.788 Mln
-31.9%
1 gen 2004 anni
244.225 Mln
+133.672 Mln
120.91%
1 gen 2005 anni
155.982 Mln
-88.243 Mln
-36.13%
1 gen 2006 anni
296.239 Mln
+140.257 Mln
89.92%
1 gen 2007 anni
151.892 Mln
-144.347 Mln
-48.73%
1 gen 2008 anni
250.981 Mln
+99.09 Mln
65.24%
1 gen 2009 anni
-75.379 Mln
-326.36 Mln
-130.03%
1 gen 2010 anni
-394.901 Mln
-319.521 Mln
423.89%
1 gen 2011 anni
-247.532 Mln
+147.369 Mln
-37.32%
1 gen 2012 anni
-77.018 Mln
+170.513 Mln
-68.89%
Classificazione dei paesi secondo i statistiche attuali per anni


Commenti: