29
/it/
it
AIzaSyAYiBZKx7MnpbEhh9jyipgxe19OcubqV5w
April 1, 2024
123070
Ecuador
ECU
true
2
1
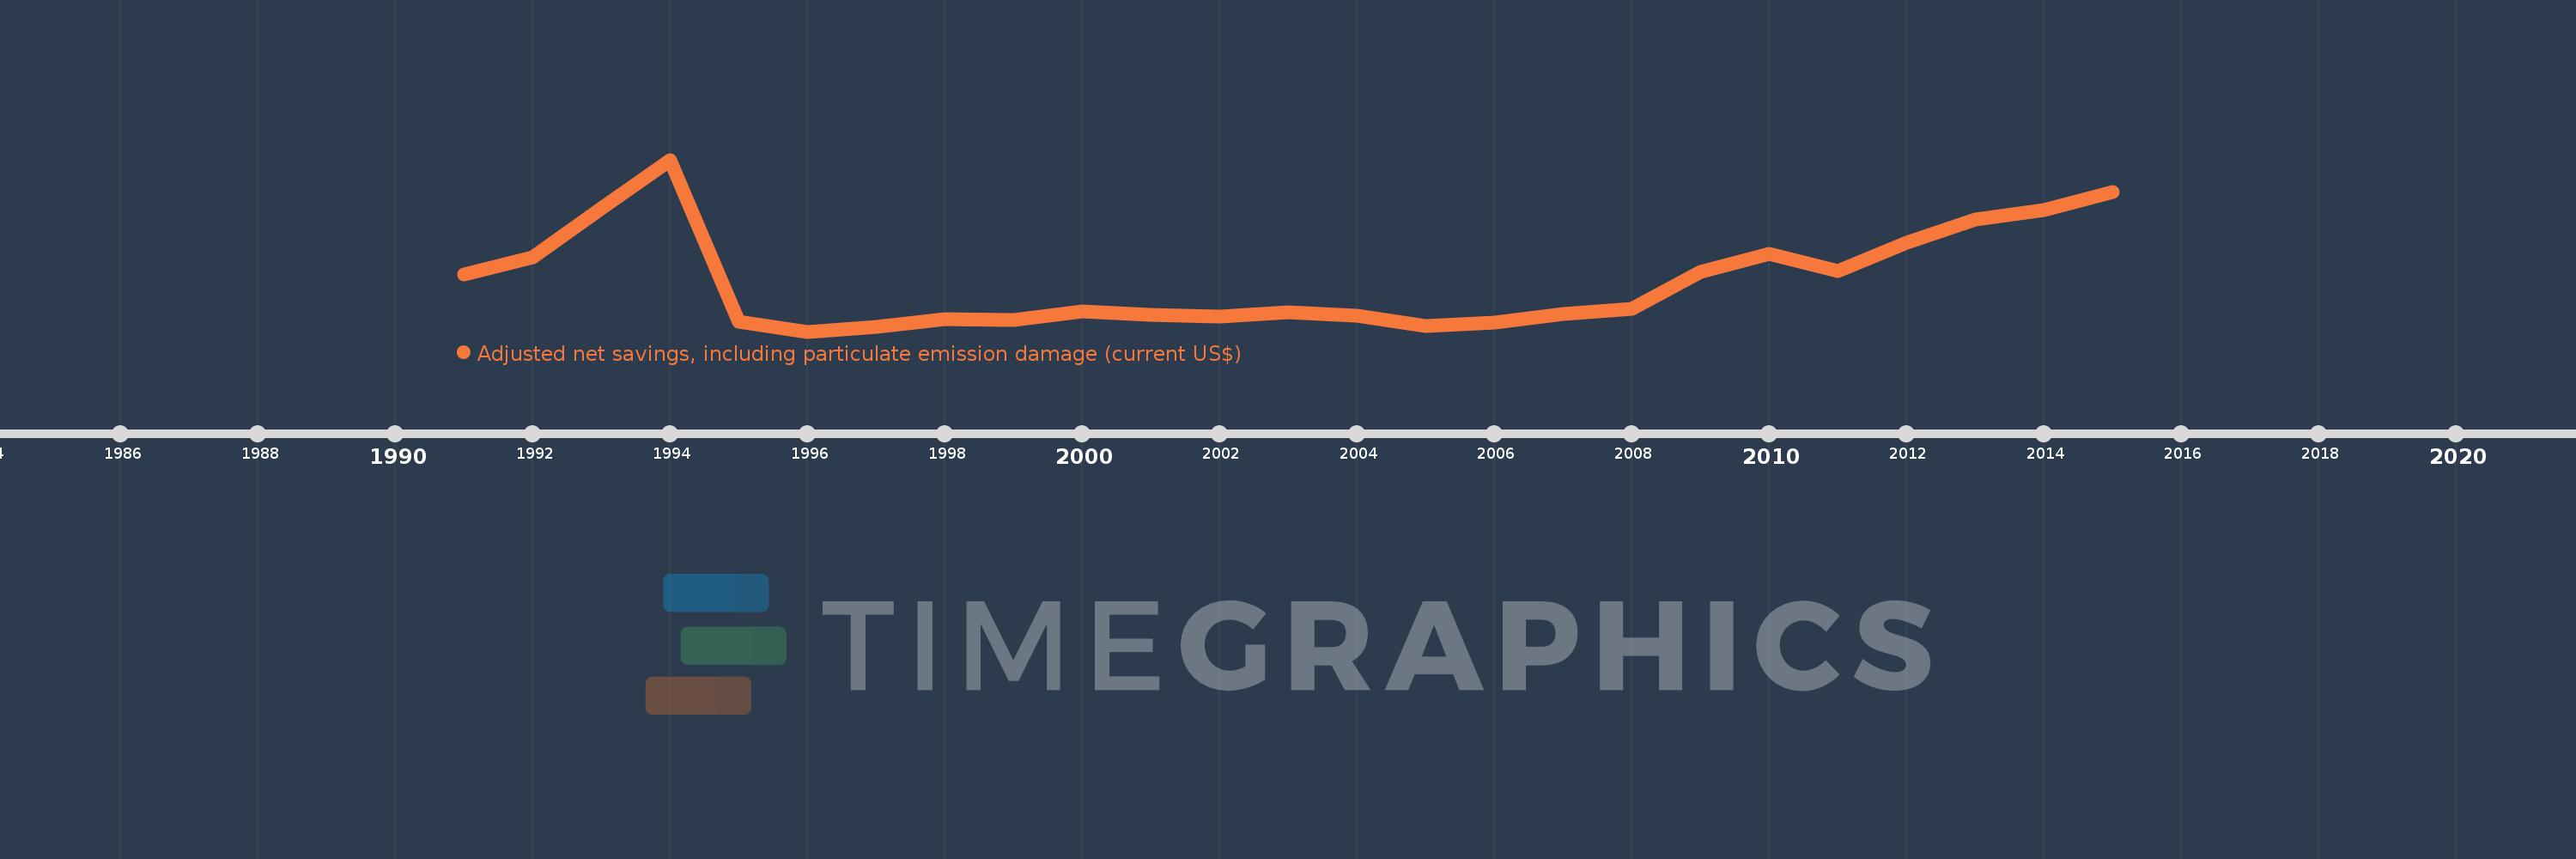
Adjusted net savings, including particulate emission damage (current US$)
2015,2014,2013,2012,2011,2010,2009,2008,2007,2006,2005,2004,2003,2002,2001,2000,1999,1998,1997,1996,1995,1994,1993,1992,1991
Queste statistiche in altri paesi:
AfghanistanAlbaniaAlgeriaAngolaArgentinaArmeniaAustraliaAustriaAzerbaijanBahamas, TheBahrainBangladeshBarbadosBelarusBelgiumBelizeBeninBhutanBoliviaBotswanaBrazilBrunei DarussalamBulgariaBurkina FasoBurundiCabo VerdeCambodiaCameroonCanadaCentral African RepublicChadChileChinaColombiaComorosCongo, Dem. Rep.Congo, Rep.Costa RicaCote d'IvoireCroatiaCyprusCzech RepublicDenmarkDominican RepublicEcuadorEgypt, Arab Rep.El SalvadorEquatorial GuineaEritreaEstoniaEthiopiaFijiFinlandFranceGabonGambia, TheGeorgiaGermanyGhanaGreeceGuatemalaGuineaGuinea-BissauGuyanaHaitiHondurasHungaryIcelandIndiaIndonesiaIran, Islamic Rep.IraqIrelandIsraelItalyJamaicaJapanJordanKazakhstanKenyaKorea, Rep.KuwaitKyrgyz RepublicLao PDRLatviaLebanonLesothoLiberiaLibyaLithuaniaLuxembourgMacedonia, FYRMadagascarMalawiMalaysiaMaldivesMaliMauritaniaMauritiusMexicoMoldovaMongoliaMoroccoMozambiqueNamibiaNepalNetherlandsNew ZealandNicaraguaNigerNigeriaNorwayOmanPakistanPanamaPapua New GuineaParaguayPeruPhilippinesPolandPortugalQatarRomaniaRussian FederationRwandaSaudi ArabiaSenegalSierra LeoneSingaporeSlovak RepublicSloveniaSolomon IslandsSouth AfricaSpainSri LankaSudanSurinameSwazilandSwedenSwitzerlandSyrian Arab RepublicTajikistanTanzaniaThailandTogoTrinidad and TobagoTunisiaTurkeyUgandaUkraineUnited KingdomUnited StatesUruguayVenezuela, RBVietnamYemen, Rep.ZambiaZimbabwe Linea del tempo:
Questa scala temporale mostra un grafico dal 1991 anno al 2015 anno. Ecuador. I dati fino ad 1990 anno non disponibili. Il numero di osservazioni attuali secondo i date: 25.
La fonte (nome):
Indicatori dello sviluppo mondiale
La fonte (organizzazione):
World Bank staff estimates based on sources and methods in World Bank's "The Changing Wealth of Nations: Measuring Sustainable Development in the New Millennium" (2011).
Categorie:
Economy & Growth, Environment
sono stati aggiornati
23 apr 2017 anni
Indicatori delle variazioni dei valori per anni
Minima:
-1.487 Mlrd
1 gen 1996 anni
Massimo:
14.087 Mlrd
1 gen 1994 anni
Alla data di osservazione
Valore
Variazione assoluta
La variazione rispetto al valore precedente
1 gen 1991 anni
3.665 Mlrd
+3.665 Mlrd
0.0%
1 gen 1992 anni
5.214 Mlrd
+1.549 Mlrd
42.26%
1 gen 1993 anni
9.677 Mlrd
+4.463 Mlrd
85.59%
1 gen 1994 anni
14.087 Mlrd
+4.41 Mlrd
45.58%
1 gen 1995 anni
-604.183 Mln
-14.691 Mlrd
-104.29%
1 gen 1996 anni
-1.487 Mlrd
-883.19 Mln
146.18%
1 gen 1997 anni
-1.046 Mlrd
+441.779 Mln
-29.7%
1 gen 1998 anni
-395.29 Mln
+650.304 Mln
-62.19%
1 gen 1999 anni
-431.283 Mln
-35.994 Mln
9.11%
1 gen 2000 anni
306.232 Mln
+737.515 Mln
-171.0%
1 gen 2001 anni
13.378 Mln
-292.854 Mln
-95.63%
1 gen 2002 anni
-162.072 Mln
-175.45 Mln
-1.31 Mille.%
1 gen 2003 anni
257.859 Mln
+419.931 Mln
-259.1%
1 gen 2004 anni
-74.737 Mln
-332.596 Mln
-128.98%
1 gen 2005 anni
-957.994 Mln
-883.257 Mln
1.18 Mille.%
1 gen 2006 anni
-645.359 Mln
+312.635 Mln
-32.63%
1 gen 2007 anni
117.361 Mln
+762.72 Mln
-118.19%
1 gen 2008 anni
599.751 Mln
+482.39 Mln
411.03%
1 gen 2009 anni
3.901 Mlrd
+3.301 Mlrd
550.47%
1 gen 2010 anni
5.553 Mlrd
+1.652 Mlrd
42.34%
1 gen 2011 anni
3.984 Mlrd
-1.569 Mlrd
-28.26%
1 gen 2012 anni
6.566 Mlrd
+2.582 Mlrd
64.81%
1 gen 2013 anni
8.663 Mlrd
+2.097 Mlrd
31.94%
1 gen 2014 anni
9.536 Mlrd
+872.816 Mln
10.08%
1 gen 2015 anni
11.152 Mlrd
+1.617 Mlrd
16.96%
Classificazione dei paesi secondo i statistiche attuali per anni


Commenti: