29
/it/
it
AIzaSyAYiBZKx7MnpbEhh9jyipgxe19OcubqV5w
April 1, 2024
69869
Argentina
ARG
true
2
1
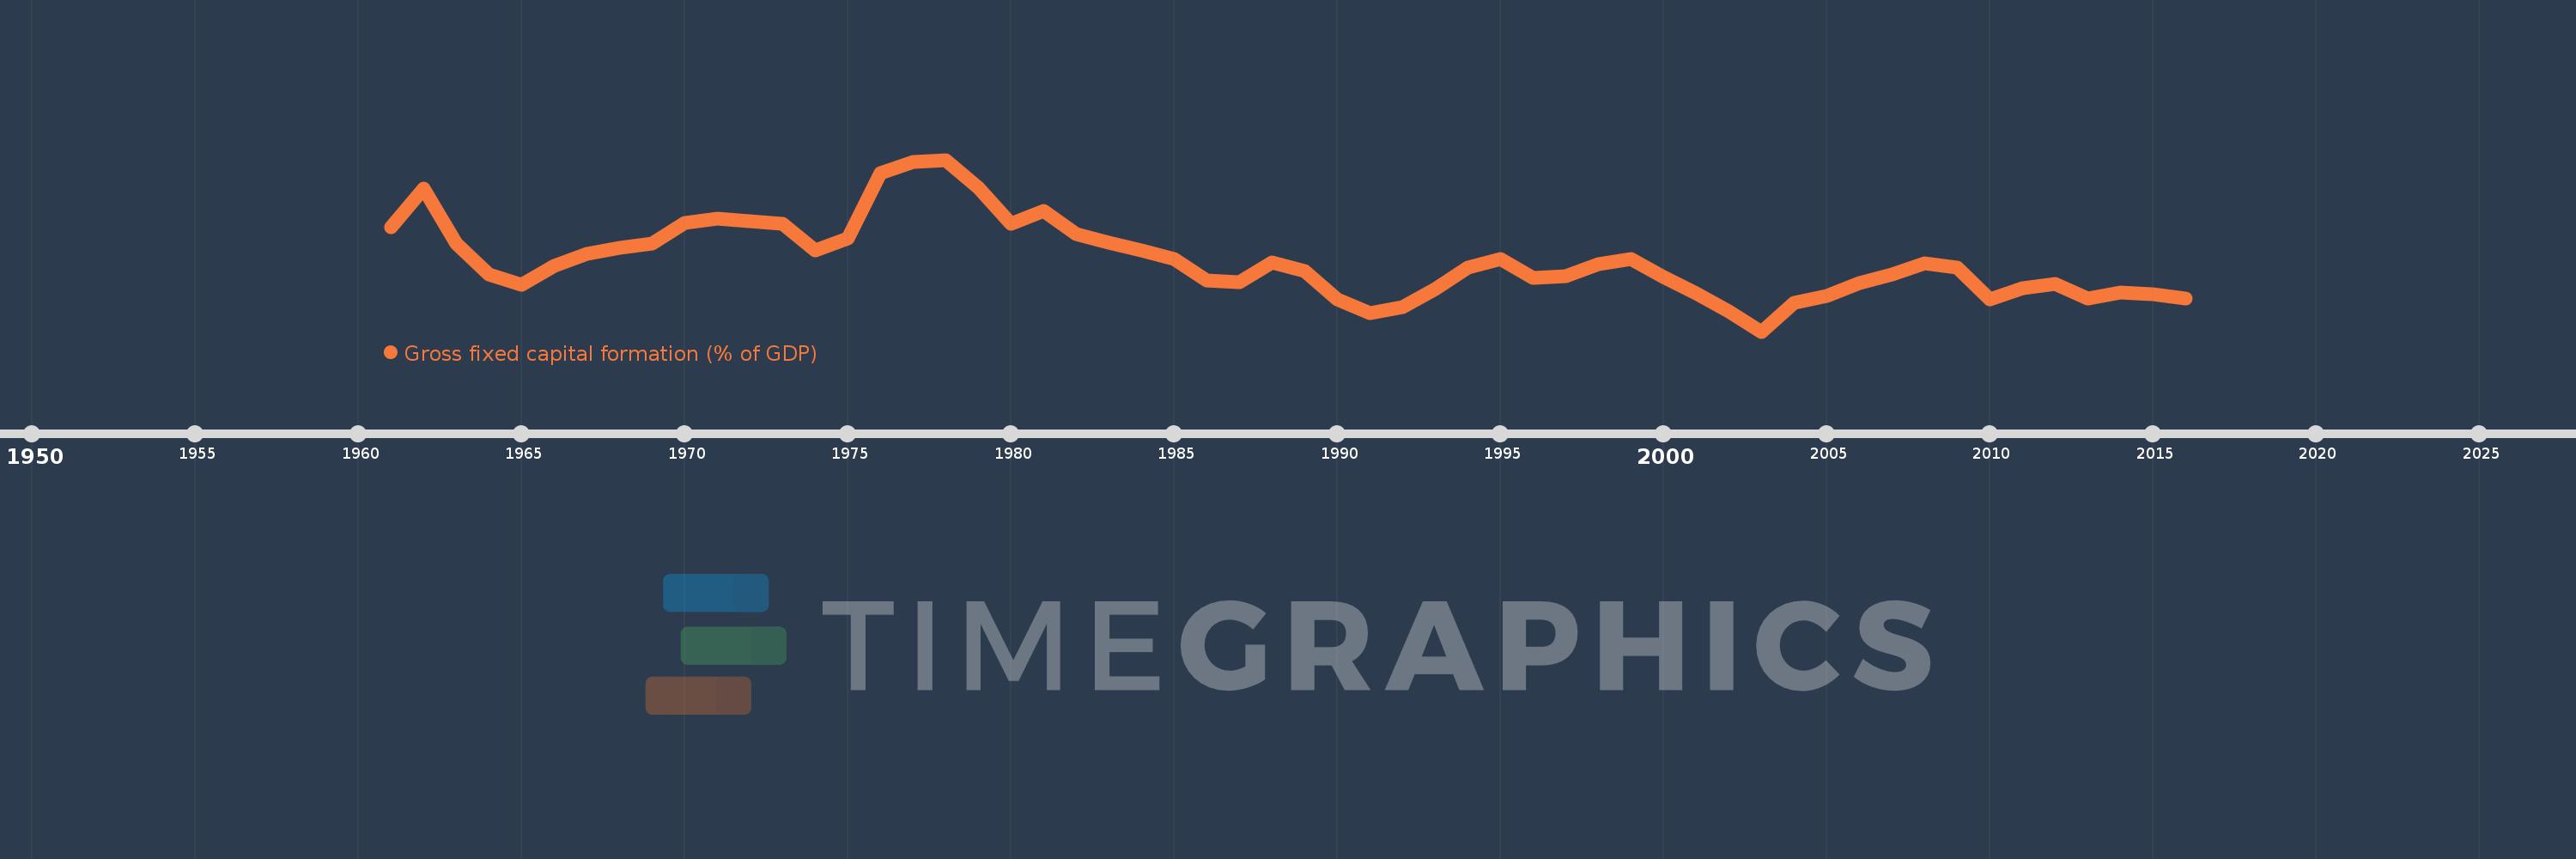
Gross fixed capital formation (% of GDP)
2016,2015,2014,2013,2012,2011,2010,2009,2008,2007,2006,2005,2004,2003,2002,2001,2000,1999,1998,1997,1996,1995,1994,1993,1992,1991,1990,1989,1988,1987,1986,1985,1984,1983,1982,1981,1980,1979,1978,1977,1976,1975,1974,1973,1972,1971,1970,1969,1968,1967,1966,1965,1964,1963,1962,1961
Queste statistiche in altri paesi:
AfghanistanAlbaniaAlgeriaAngolaAntigua and BarbudaArab WorldArgentinaArmeniaArubaAustraliaAustriaAzerbaijanBahamas, TheBahrainBangladeshBarbadosBelarusBelgiumBelizeBeninBermudaBhutanBoliviaBosnia and HerzegovinaBotswanaBrazilBrunei DarussalamBulgariaBurkina FasoBurundiCabo VerdeCambodiaCameroonCanadaCaribbean small statesCentral African RepublicCentral Europe and the BalticsChadChileChinaColombiaComorosCongo, Dem. Rep.Congo, Rep.Costa RicaCote d'IvoireCroatiaCubaCyprusCzech RepublicDenmarkDjiboutiDominicaDominican RepublicEarly-demographic dividendEast Asia & PacificEast Asia & Pacific (excluding high income)East Asia & Pacific (IDA & IBRD countries)EcuadorEgypt, Arab Rep.El SalvadorEquatorial GuineaEritreaEstoniaEthiopiaEuro areaEurope & Central AsiaEurope & Central Asia (excluding high income)Europe & Central Asia (IDA & IBRD countries)European UnionFijiFinlandFragile and conflict affected situationsFranceGabonGambia, TheGeorgiaGermanyGhanaGreeceGrenadaGuatemalaGuineaGuinea-BissauGuyanaHaitiHeavily indebted poor countries (HIPC)High incomeHondurasHong Kong SAR, ChinaHungaryIBRD onlyIcelandIDA & IBRD totalIDA blendIDA onlyIDA totalIndiaIndonesiaIran, Islamic Rep.IraqIrelandIsraelItalyJamaicaJapanJordanKazakhstanKenyaKiribatiKorea, Rep.KosovoKuwaitKyrgyz RepublicLao PDRLate-demographic dividendLatin America & Caribbean Latin America & Caribbean (excluding high income)Latin America & the Caribbean (IDA & IBRD countries)LatviaLeast developed countries: UN classificationLebanonLesothoLiberiaLibyaLithuaniaLow & middle incomeLow incomeLower middle incomeLuxembourgMacao SAR, ChinaMacedonia, FYRMadagascarMalawiMalaysiaMaldivesMaliMaltaMauritaniaMauritiusMexicoMicronesia, Fed. Sts.Middle East & North AfricaMiddle East & North Africa (excluding high income)Middle East & North Africa (IDA & IBRD countries)Middle incomeMoldovaMongoliaMontenegroMoroccoMozambiqueNamibiaNepalNetherlandsNew CaledoniaNew ZealandNicaraguaNigerNigeriaNorth AmericaNorwayOECD membersOmanPacific island small statesPakistanPanamaPapua New GuineaParaguayPeruPhilippinesPolandPortugalPost-demographic dividendPre-demographic dividendPuerto RicoRomaniaRussian FederationRwandaSaudi ArabiaSenegalSerbiaSeychellesSierra LeoneSingaporeSlovak RepublicSloveniaSolomon IslandsSomaliaSouth AfricaSouth AsiaSouth Asia (IDA & IBRD)South SudanSpainSri LankaSt. Kitts and NevisSt. LuciaSt. Vincent and the GrenadinesSub-Saharan Africa Sub-Saharan Africa (excluding high income)Sub-Saharan Africa (IDA & IBRD countries)SudanSurinameSwazilandSwedenSwitzerlandSyrian Arab RepublicTajikistanTanzaniaThailandTimor-LesteTogoTongaTrinidad and TobagoTunisiaTurkeyTurkmenistanUgandaUkraineUnited Arab EmiratesUnited KingdomUnited StatesUpper middle incomeUruguayUzbekistanVanuatuVenezuela, RBVietnamWest Bank and GazaWorldYemen, Rep.ZambiaZimbabwe Linea del tempo:
Questa scala temporale mostra un grafico dal 1961 anno al 2016 anno. Argentina. I dati fino ad 1960 anno non disponibili. Il numero di osservazioni attuali secondo i date: 56.
La fonte (nome):
Indicatori dello sviluppo mondiale
La fonte (organizzazione):
World Bank national accounts data, and OECD National Accounts data files.
Categorie:
Economy & Growth
sono stati aggiornati
23 apr 2017 anni
Indicatori delle variazioni dei valori per anni
Minima:
11.961
1 gen 2003 anni
Massimo:
30.942
1 gen 1978 anni
Alla data di osservazione
Valore
Variazione assoluta
La variazione rispetto al valore precedente
1 gen 1961 anni
23.479
+23.479
0.0%
1 gen 1962 anni
27.766
+4.287
18.26%
1 gen 1963 anni
21.731
-6.035
-21.74%
1 gen 1964 anni
18.273
-3.458
-15.91%
1 gen 1965 anni
17.179
-1.094
-5.99%
1 gen 1966 anni
19.223
+2.045
11.9%
1 gen 1967 anni
20.543
+1.319
6.86%
1 gen 1968 anni
21.215
+0.672
3.27%
1 gen 1969 anni
21.69
+0.475
2.24%
1 gen 1970 anni
23.991
+2.3
10.6%
1 gen 1971 anni
24.44
+0.449
1.87%
1 gen 1972 anni
24.113
-0.327
-1.34%
1 gen 1973 anni
23.892
-0.221
-0.92%
1 gen 1974 anni
20.894
-2.998
-12.55%
1 gen 1975 anni
22.26
+1.367
6.54%
1 gen 1976 anni
29.441
+7.181
32.26%
1 gen 1977 anni
30.729
+1.288
4.38%
1 gen 1978 anni
30.942
+0.212
0.69%
1 gen 1979 anni
27.822
-3.12
-10.08%
1 gen 1980 anni
23.915
-3.907
-14.04%
1 gen 1981 anni
25.258
+1.343
5.61%
1 gen 1982 anni
22.691
-2.567
-10.16%
1 gen 1983 anni
21.755
-0.936
-4.13%
1 gen 1984 anni
20.888
-0.867
-3.99%
1 gen 1985 anni
19.964
-0.924
-4.42%
1 gen 1986 anni
17.589
-2.375
-11.9%
1 gen 1987 anni
17.462
-0.127
-0.72%
1 gen 1988 anni
19.555
+2.093
11.99%
1 gen 1989 anni
18.64
-0.915
-4.68%
1 gen 1990 anni
15.515
-3.125
-16.77%
1 gen 1991 anni
13.997
-1.518
-9.78%
1 gen 1992 anni
14.637
+0.64
4.57%
1 gen 1993 anni
16.702
+2.065
14.11%
1 gen 1994 anni
19.056
+2.354
14.09%
1 gen 1995 anni
19.939
+0.882
4.63%
1 gen 1996 anni
17.938
-2.001
-10.04%
1 gen 1997 anni
18.082
+0.144
0.8%
1 gen 1998 anni
19.37
+1.288
7.12%
1 gen 1999 anni
19.935
+0.565
2.92%
1 gen 2000 anni
18.014
-1.921
-9.64%
1 gen 2001 anni
16.193
-1.821
-10.11%
1 gen 2002 anni
14.179
-2.014
-12.43%
1 gen 2003 anni
11.961
-2.219
-15.65%
1 gen 2004 anni
15.138
+3.177
26.56%
1 gen 2005 anni
15.894
+0.756
5.0%
1 gen 2006 anni
17.307
+1.413
8.89%
1 gen 2007 anni
18.27
+0.963
5.56%
1 gen 2008 anni
19.538
+1.268
6.94%
1 gen 2009 anni
19.051
-0.487
-2.49%
1 gen 2010 anni
15.499
-3.552
-18.65%
1 gen 2011 anni
16.708
+1.209
7.8%
1 gen 2012 anni
17.225
+0.517
3.09%
1 gen 2013 anni
15.652
-1.573
-9.13%
1 gen 2014 anni
16.303
+0.65
4.16%
1 gen 2015 anni
16.05
-0.253
-1.55%
1 gen 2016 anni
15.606
-0.444
-2.76%
Classificazione dei paesi secondo i statistiche attuali per anni


Commenti: