29
/it/
it
AIzaSyAYiBZKx7MnpbEhh9jyipgxe19OcubqV5w
April 1, 2024
266898
Trinidad and Tobago
TTO
true
2
1
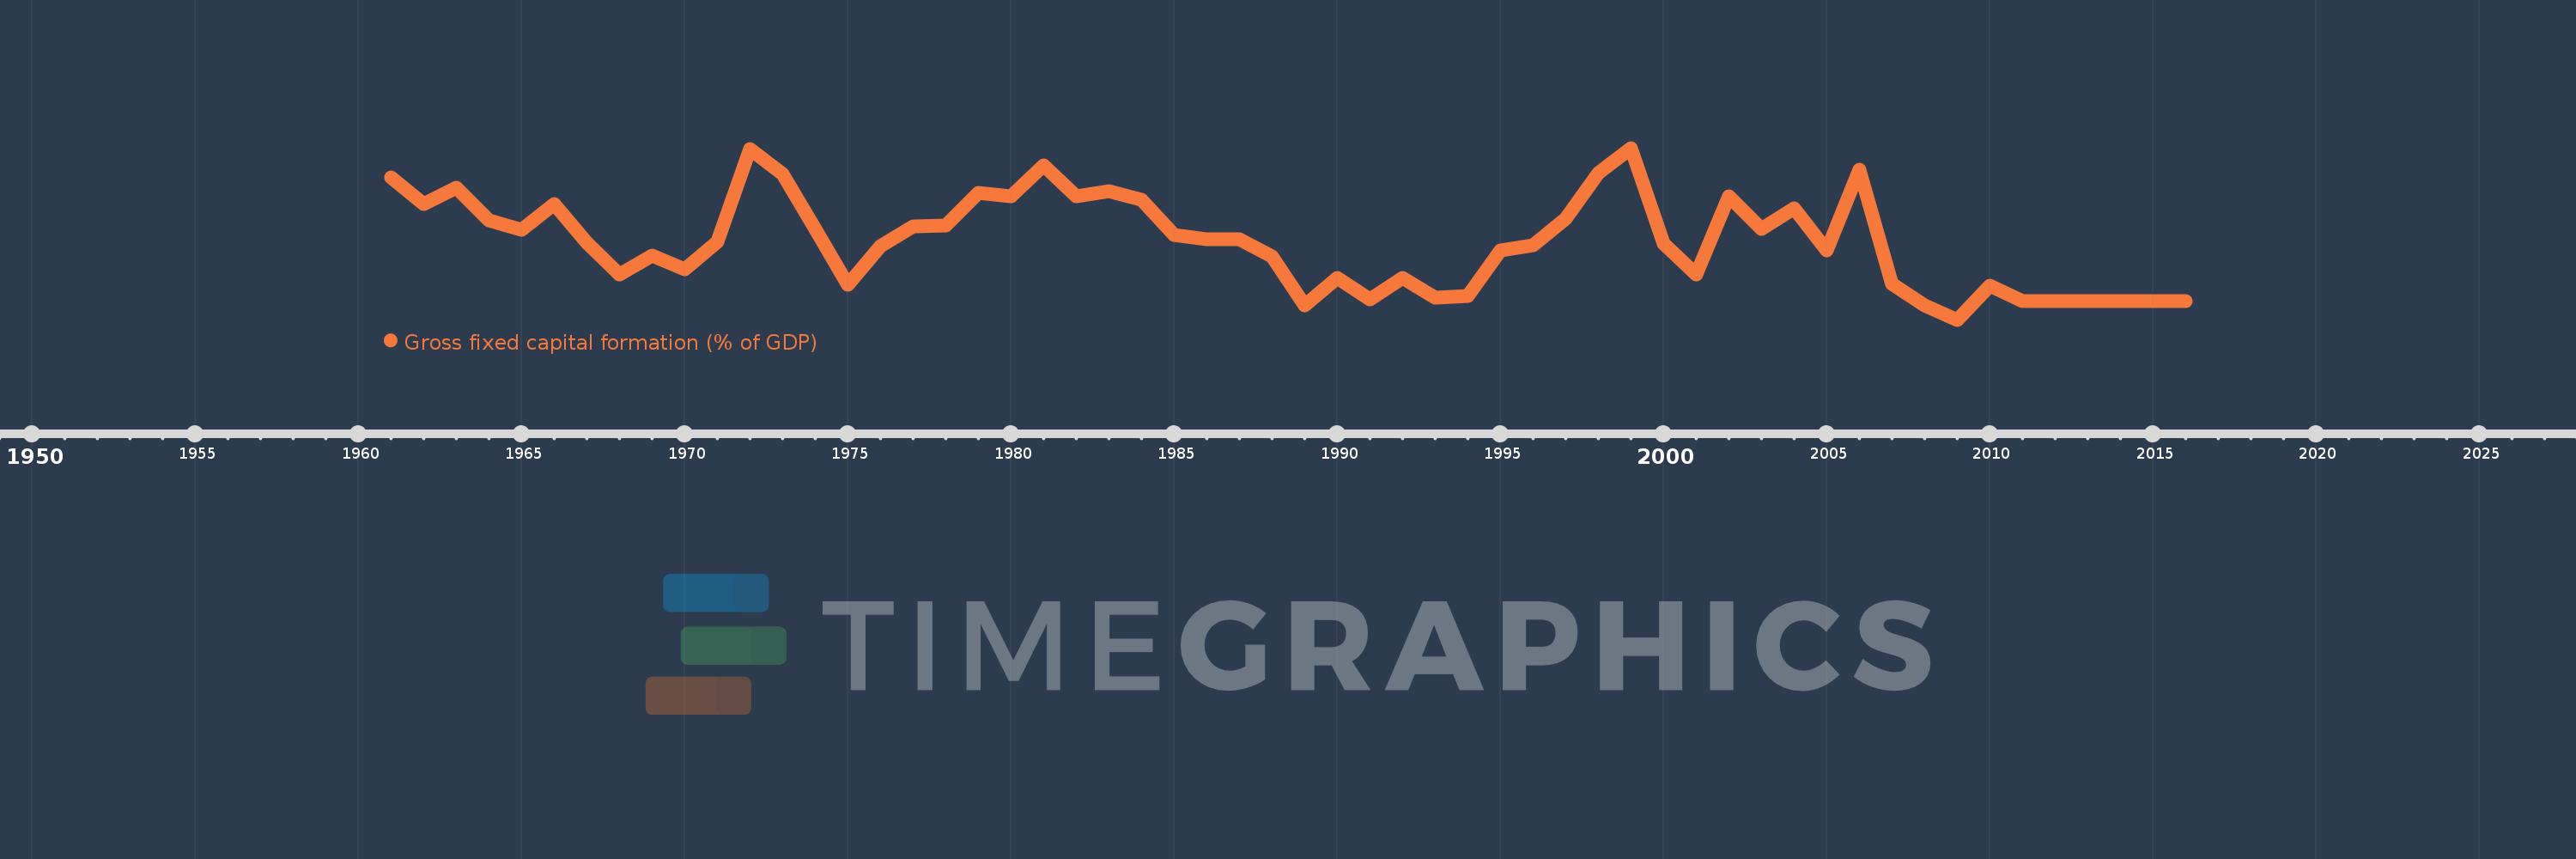
Gross fixed capital formation (% of GDP)
2016,2015,2014,2013,2012,2011,2010,2009,2008,2007,2006,2005,2004,2003,2002,2001,2000,1999,1998,1997,1996,1995,1994,1993,1992,1991,1990,1989,1988,1987,1986,1985,1984,1983,1982,1981,1980,1979,1978,1977,1976,1975,1974,1973,1972,1971,1970,1969,1968,1967,1966,1965,1964,1963,1962,1961
Queste statistiche in altri paesi:
AfghanistanAlbaniaAlgeriaAngolaAntigua and BarbudaArab WorldArgentinaArmeniaArubaAustraliaAustriaAzerbaijanBahamas, TheBahrainBangladeshBarbadosBelarusBelgiumBelizeBeninBermudaBhutanBoliviaBosnia and HerzegovinaBotswanaBrazilBrunei DarussalamBulgariaBurkina FasoBurundiCabo VerdeCambodiaCameroonCanadaCaribbean small statesCentral African RepublicCentral Europe and the BalticsChadChileChinaColombiaComorosCongo, Dem. Rep.Congo, Rep.Costa RicaCote d'IvoireCroatiaCubaCyprusCzech RepublicDenmarkDjiboutiDominicaDominican RepublicEarly-demographic dividendEast Asia & PacificEast Asia & Pacific (excluding high income)East Asia & Pacific (IDA & IBRD countries)EcuadorEgypt, Arab Rep.El SalvadorEquatorial GuineaEritreaEstoniaEthiopiaEuro areaEurope & Central AsiaEurope & Central Asia (excluding high income)Europe & Central Asia (IDA & IBRD countries)European UnionFijiFinlandFragile and conflict affected situationsFranceGabonGambia, TheGeorgiaGermanyGhanaGreeceGrenadaGuatemalaGuineaGuinea-BissauGuyanaHaitiHeavily indebted poor countries (HIPC)High incomeHondurasHong Kong SAR, ChinaHungaryIBRD onlyIcelandIDA & IBRD totalIDA blendIDA onlyIDA totalIndiaIndonesiaIran, Islamic Rep.IraqIrelandIsraelItalyJamaicaJapanJordanKazakhstanKenyaKiribatiKorea, Rep.KosovoKuwaitKyrgyz RepublicLao PDRLate-demographic dividendLatin America & Caribbean Latin America & Caribbean (excluding high income)Latin America & the Caribbean (IDA & IBRD countries)LatviaLeast developed countries: UN classificationLebanonLesothoLiberiaLibyaLithuaniaLow & middle incomeLow incomeLower middle incomeLuxembourgMacao SAR, ChinaMacedonia, FYRMadagascarMalawiMalaysiaMaldivesMaliMaltaMauritaniaMauritiusMexicoMicronesia, Fed. Sts.Middle East & North AfricaMiddle East & North Africa (excluding high income)Middle East & North Africa (IDA & IBRD countries)Middle incomeMoldovaMongoliaMontenegroMoroccoMozambiqueNamibiaNepalNetherlandsNew CaledoniaNew ZealandNicaraguaNigerNigeriaNorth AmericaNorwayOECD membersOmanPacific island small statesPakistanPanamaPapua New GuineaParaguayPeruPhilippinesPolandPortugalPost-demographic dividendPre-demographic dividendPuerto RicoRomaniaRussian FederationRwandaSaudi ArabiaSenegalSerbiaSeychellesSierra LeoneSingaporeSlovak RepublicSloveniaSolomon IslandsSomaliaSouth AfricaSouth AsiaSouth Asia (IDA & IBRD)South SudanSpainSri LankaSt. Kitts and NevisSt. LuciaSt. Vincent and the GrenadinesSub-Saharan Africa Sub-Saharan Africa (excluding high income)Sub-Saharan Africa (IDA & IBRD countries)SudanSurinameSwazilandSwedenSwitzerlandSyrian Arab RepublicTajikistanTanzaniaThailandTimor-LesteTogoTongaTrinidad and TobagoTunisiaTurkeyTurkmenistanUgandaUkraineUnited Arab EmiratesUnited KingdomUnited StatesUpper middle incomeUruguayUzbekistanVanuatuVenezuela, RBVietnamWest Bank and GazaWorldYemen, Rep.ZambiaZimbabwe Linea del tempo:
Questa scala temporale mostra un grafico dal 1961 anno al 2016 anno. Trinidad and Tobago. I dati fino ad 1960 anno non disponibili. Il numero di osservazioni attuali secondo i date: 56.
La fonte (nome):
Indicatori dello sviluppo mondiale
La fonte (organizzazione):
World Bank national accounts data, and OECD National Accounts data files.
Categorie:
Economy & Growth
sono stati aggiornati
23 apr 2017 anni
Indicatori delle variazioni dei valori per anni
Minima:
11.078
1 gen 2009 anni
Massimo:
32.914
1 gen 1999 anni
Alla data di osservazione
Valore
Variazione assoluta
La variazione rispetto al valore precedente
1 gen 1961 anni
29.217
+29.217
0.0%
1 gen 1962 anni
25.808
-3.409
-11.67%
1 gen 1963 anni
27.823
+2.016
7.81%
1 gen 1964 anni
23.721
-4.103
-14.75%
1 gen 1965 anni
22.476
-1.244
-5.25%
1 gen 1966 anni
25.786
+3.31
14.73%
1 gen 1967 anni
20.827
-4.959
-19.23%
1 gen 1968 anni
16.845
-3.982
-19.12%
1 gen 1969 anni
19.252
+2.406
14.28%
1 gen 1970 anni
17.479
-1.772
-9.2%
1 gen 1971 anni
20.941
+3.461
19.8%
1 gen 1972 anni
32.795
+11.854
56.61%
1 gen 1973 anni
29.565
-3.23
-9.85%
1 gen 1974 anni
22.588
-6.977
-23.6%
1 gen 1975 anni
15.522
-7.066
-31.28%
1 gen 1976 anni
20.469
+4.947
31.87%
1 gen 1977 anni
22.952
+2.483
12.13%
1 gen 1978 anni
23.037
+0.084
0.37%
1 gen 1979 anni
27.169
+4.132
17.94%
1 gen 1980 anni
26.726
-0.443
-1.63%
1 gen 1981 anni
30.67
+3.944
14.76%
1 gen 1982 anni
26.739
-3.931
-12.82%
1 gen 1983 anni
27.399
+0.661
2.47%
1 gen 1984 anni
26.351
-1.048
-3.83%
1 gen 1985 anni
21.867
-4.484
-17.02%
1 gen 1986 anni
21.255
-0.612
-2.8%
1 gen 1987 anni
21.344
+0.089
0.42%
1 gen 1988 anni
19.1
-2.244
-10.51%
1 gen 1989 anni
12.896
-6.205
-32.48%
1 gen 1990 anni
16.377
+3.482
27.0%
1 gen 1991 anni
13.645
-2.732
-16.68%
1 gen 1992 anni
16.407
+2.762
20.24%
1 gen 1993 anni
13.91
-2.497
-15.22%
1 gen 1994 anni
14.139
+0.229
1.65%
1 gen 1995 anni
19.918
+5.779
40.87%
1 gen 1996 anni
20.49
+0.571
2.87%
1 gen 1997 anni
23.934
+3.444
16.81%
1 gen 1998 anni
29.691
+5.758
24.06%
1 gen 1999 anni
32.914
+3.223
10.85%
1 gen 2000 anni
20.715
-12.199
-37.06%
1 gen 2001 anni
16.786
-3.929
-18.97%
1 gen 2002 anni
26.713
+9.927
59.14%
1 gen 2003 anni
22.626
-4.087
-15.3%
1 gen 2004 anni
25.188
+2.562
11.32%
1 gen 2005 anni
19.863
-5.325
-21.14%
1 gen 2006 anni
30.176
+10.313
51.92%
1 gen 2007 anni
15.65
-14.526
-48.14%
1 gen 2008 anni
12.899
-2.75
-17.57%
1 gen 2009 anni
11.078
-1.822
-14.12%
1 gen 2010 anni
15.465
+4.387
39.6%
1 gen 2011 anni
13.402
-2.063
-13.34%
1 gen 2012 anni
13.423
+0.021
0.16%
1 gen 2013 anni
13.423
0.0
0.0%
1 gen 2014 anni
13.423
0.0
0.0%
1 gen 2015 anni
13.423
0.0
0.0%
1 gen 2016 anni
13.423
0.0
0.0%
Classificazione dei paesi secondo i statistiche attuali per anni


Commenti: