29
/it/
it
AIzaSyAYiBZKx7MnpbEhh9jyipgxe19OcubqV5w
April 1, 2024
262303
Thailand
THA
true
2
1
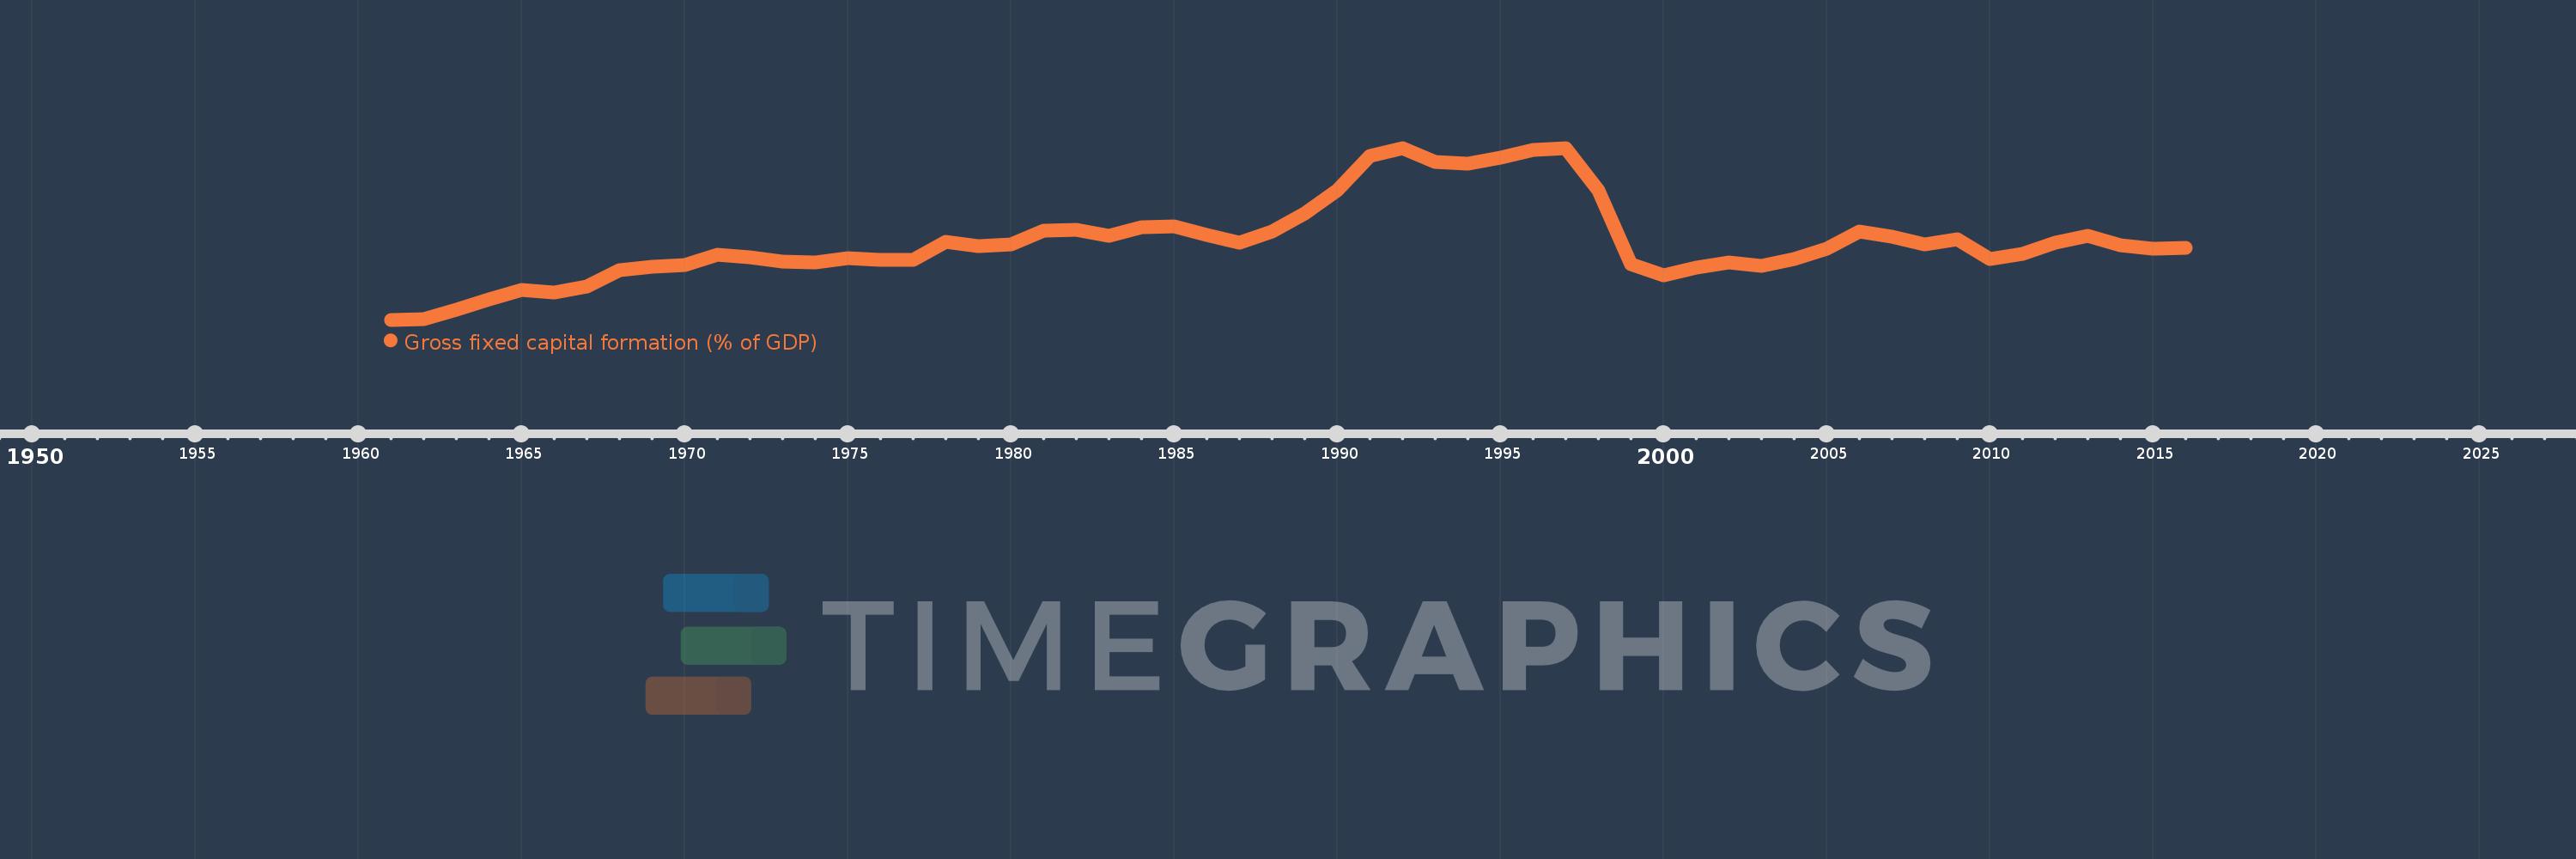
Gross fixed capital formation (% of GDP)
2016,2015,2014,2013,2012,2011,2010,2009,2008,2007,2006,2005,2004,2003,2002,2001,2000,1999,1998,1997,1996,1995,1994,1993,1992,1991,1990,1989,1988,1987,1986,1985,1984,1983,1982,1981,1980,1979,1978,1977,1976,1975,1974,1973,1972,1971,1970,1969,1968,1967,1966,1965,1964,1963,1962,1961
Queste statistiche in altri paesi:
AfghanistanAlbaniaAlgeriaAngolaAntigua and BarbudaArab WorldArgentinaArmeniaArubaAustraliaAustriaAzerbaijanBahamas, TheBahrainBangladeshBarbadosBelarusBelgiumBelizeBeninBermudaBhutanBoliviaBosnia and HerzegovinaBotswanaBrazilBrunei DarussalamBulgariaBurkina FasoBurundiCabo VerdeCambodiaCameroonCanadaCaribbean small statesCentral African RepublicCentral Europe and the BalticsChadChileChinaColombiaComorosCongo, Dem. Rep.Congo, Rep.Costa RicaCote d'IvoireCroatiaCubaCyprusCzech RepublicDenmarkDjiboutiDominicaDominican RepublicEarly-demographic dividendEast Asia & PacificEast Asia & Pacific (excluding high income)East Asia & Pacific (IDA & IBRD countries)EcuadorEgypt, Arab Rep.El SalvadorEquatorial GuineaEritreaEstoniaEthiopiaEuro areaEurope & Central AsiaEurope & Central Asia (excluding high income)Europe & Central Asia (IDA & IBRD countries)European UnionFijiFinlandFragile and conflict affected situationsFranceGabonGambia, TheGeorgiaGermanyGhanaGreeceGrenadaGuatemalaGuineaGuinea-BissauGuyanaHaitiHeavily indebted poor countries (HIPC)High incomeHondurasHong Kong SAR, ChinaHungaryIBRD onlyIcelandIDA & IBRD totalIDA blendIDA onlyIDA totalIndiaIndonesiaIran, Islamic Rep.IraqIrelandIsraelItalyJamaicaJapanJordanKazakhstanKenyaKiribatiKorea, Rep.KosovoKuwaitKyrgyz RepublicLao PDRLate-demographic dividendLatin America & Caribbean Latin America & Caribbean (excluding high income)Latin America & the Caribbean (IDA & IBRD countries)LatviaLeast developed countries: UN classificationLebanonLesothoLiberiaLibyaLithuaniaLow & middle incomeLow incomeLower middle incomeLuxembourgMacao SAR, ChinaMacedonia, FYRMadagascarMalawiMalaysiaMaldivesMaliMaltaMauritaniaMauritiusMexicoMicronesia, Fed. Sts.Middle East & North AfricaMiddle East & North Africa (excluding high income)Middle East & North Africa (IDA & IBRD countries)Middle incomeMoldovaMongoliaMontenegroMoroccoMozambiqueNamibiaNepalNetherlandsNew CaledoniaNew ZealandNicaraguaNigerNigeriaNorth AmericaNorwayOECD membersOmanPacific island small statesPakistanPanamaPapua New GuineaParaguayPeruPhilippinesPolandPortugalPost-demographic dividendPre-demographic dividendPuerto RicoRomaniaRussian FederationRwandaSaudi ArabiaSenegalSerbiaSeychellesSierra LeoneSingaporeSlovak RepublicSloveniaSolomon IslandsSomaliaSouth AfricaSouth AsiaSouth Asia (IDA & IBRD)South SudanSpainSri LankaSt. Kitts and NevisSt. LuciaSt. Vincent and the GrenadinesSub-Saharan Africa Sub-Saharan Africa (excluding high income)Sub-Saharan Africa (IDA & IBRD countries)SudanSurinameSwazilandSwedenSwitzerlandSyrian Arab RepublicTajikistanTanzaniaThailandTimor-LesteTogoTongaTrinidad and TobagoTunisiaTurkeyTurkmenistanUgandaUkraineUnited Arab EmiratesUnited KingdomUnited StatesUpper middle incomeUruguayUzbekistanVanuatuVenezuela, RBVietnamWest Bank and GazaWorldYemen, Rep.ZambiaZimbabwe Linea del tempo:
Questa scala temporale mostra un grafico dal 1961 anno al 2016 anno. Thailand. I dati fino ad 1960 anno non disponibili. Il numero di osservazioni attuali secondo i date: 56.
La fonte (nome):
Indicatori dello sviluppo mondiale
La fonte (organizzazione):
World Bank national accounts data, and OECD National Accounts data files.
Categorie:
Economy & Growth
sono stati aggiornati
23 apr 2017 anni
Indicatori delle variazioni dei valori per anni
Minima:
12.919
1 gen 1961 anni
Massimo:
41.655
1 gen 1997 anni
Alla data di osservazione
Valore
Variazione assoluta
La variazione rispetto al valore precedente
1 gen 1961 anni
12.919
+12.919
0.0%
1 gen 1962 anni
13.014
+0.095
0.73%
1 gen 1963 anni
14.608
+1.594
12.25%
1 gen 1964 anni
16.387
+1.779
12.18%
1 gen 1965 anni
17.948
+1.561
9.53%
1 gen 1966 anni
17.511
-0.437
-2.43%
1 gen 1967 anni
18.545
+1.034
5.9%
1 gen 1968 anni
21.254
+2.709
14.61%
1 gen 1969 anni
21.724
+0.469
2.21%
1 gen 1970 anni
22.098
+0.374
1.72%
1 gen 1971 anni
23.742
+1.644
7.44%
1 gen 1972 anni
23.329
-0.412
-1.74%
1 gen 1973 anni
22.711
-0.618
-2.65%
1 gen 1974 anni
22.484
-0.227
-1.0%
1 gen 1975 anni
23.292
+0.808
3.59%
1 gen 1976 anni
22.875
-0.417
-1.79%
1 gen 1977 anni
22.905
+0.03
0.13%
1 gen 1978 anni
25.929
+3.023
13.2%
1 gen 1979 anni
25.246
-0.683
-2.63%
1 gen 1980 anni
25.561
+0.315
1.25%
1 gen 1981 anni
27.772
+2.212
8.65%
1 gen 1982 anni
27.99
+0.217
0.78%
1 gen 1983 anni
26.941
-1.049
-3.75%
1 gen 1984 anni
28.463
+1.522
5.65%
1 gen 1985 anni
28.601
+0.138
0.49%
1 gen 1986 anni
27.165
-1.436
-5.02%
1 gen 1987 anni
25.78
-1.385
-5.1%
1 gen 1988 anni
27.638
+1.858
7.21%
1 gen 1989 anni
30.679
+3.041
11.0%
1 gen 1990 anni
34.619
+3.94
12.84%
1 gen 1991 anni
40.382
+5.763
16.65%
1 gen 1992 anni
41.632
+1.249
3.09%
1 gen 1993 anni
39.255
-2.376
-5.71%
1 gen 1994 anni
39.064
-0.191
-0.49%
1 gen 1995 anni
40.0
+0.935
2.39%
1 gen 1996 anni
41.321
+1.322
3.3%
1 gen 1997 anni
41.655
+0.334
0.81%
1 gen 1998 anni
34.612
-7.043
-16.91%
1 gen 1999 anni
22.152
-12.46
-36.0%
1 gen 2000 anni
20.41
-1.742
-7.86%
1 gen 2001 anni
21.575
+1.165
5.71%
1 gen 2002 anni
22.48
+0.905
4.2%
1 gen 2003 anni
21.912
-0.569
-2.53%
1 gen 2004 anni
23.032
+1.12
5.11%
1 gen 2005 anni
24.864
+1.832
7.96%
1 gen 2006 anni
27.713
+2.848
11.46%
1 gen 2007 anni
26.847
-0.866
-3.13%
1 gen 2008 anni
25.456
-1.39
-5.18%
1 gen 2009 anni
26.448
+0.992
3.89%
1 gen 2010 anni
23.12
-3.328
-12.58%
1 gen 2011 anni
24.005
+0.885
3.83%
1 gen 2012 anni
25.851
+1.846
7.69%
1 gen 2013 anni
27.007
+1.156
4.47%
1 gen 2014 anni
25.423
-1.584
-5.87%
1 gen 2015 anni
24.821
-0.602
-2.37%
1 gen 2016 anni
24.938
+0.117
0.47%
Classificazione dei paesi secondo i statistiche attuali per anni


Commenti: