29
/it/
it
AIzaSyAYiBZKx7MnpbEhh9jyipgxe19OcubqV5w
April 1, 2024
216484
Pakistan
PAK
true
2
1
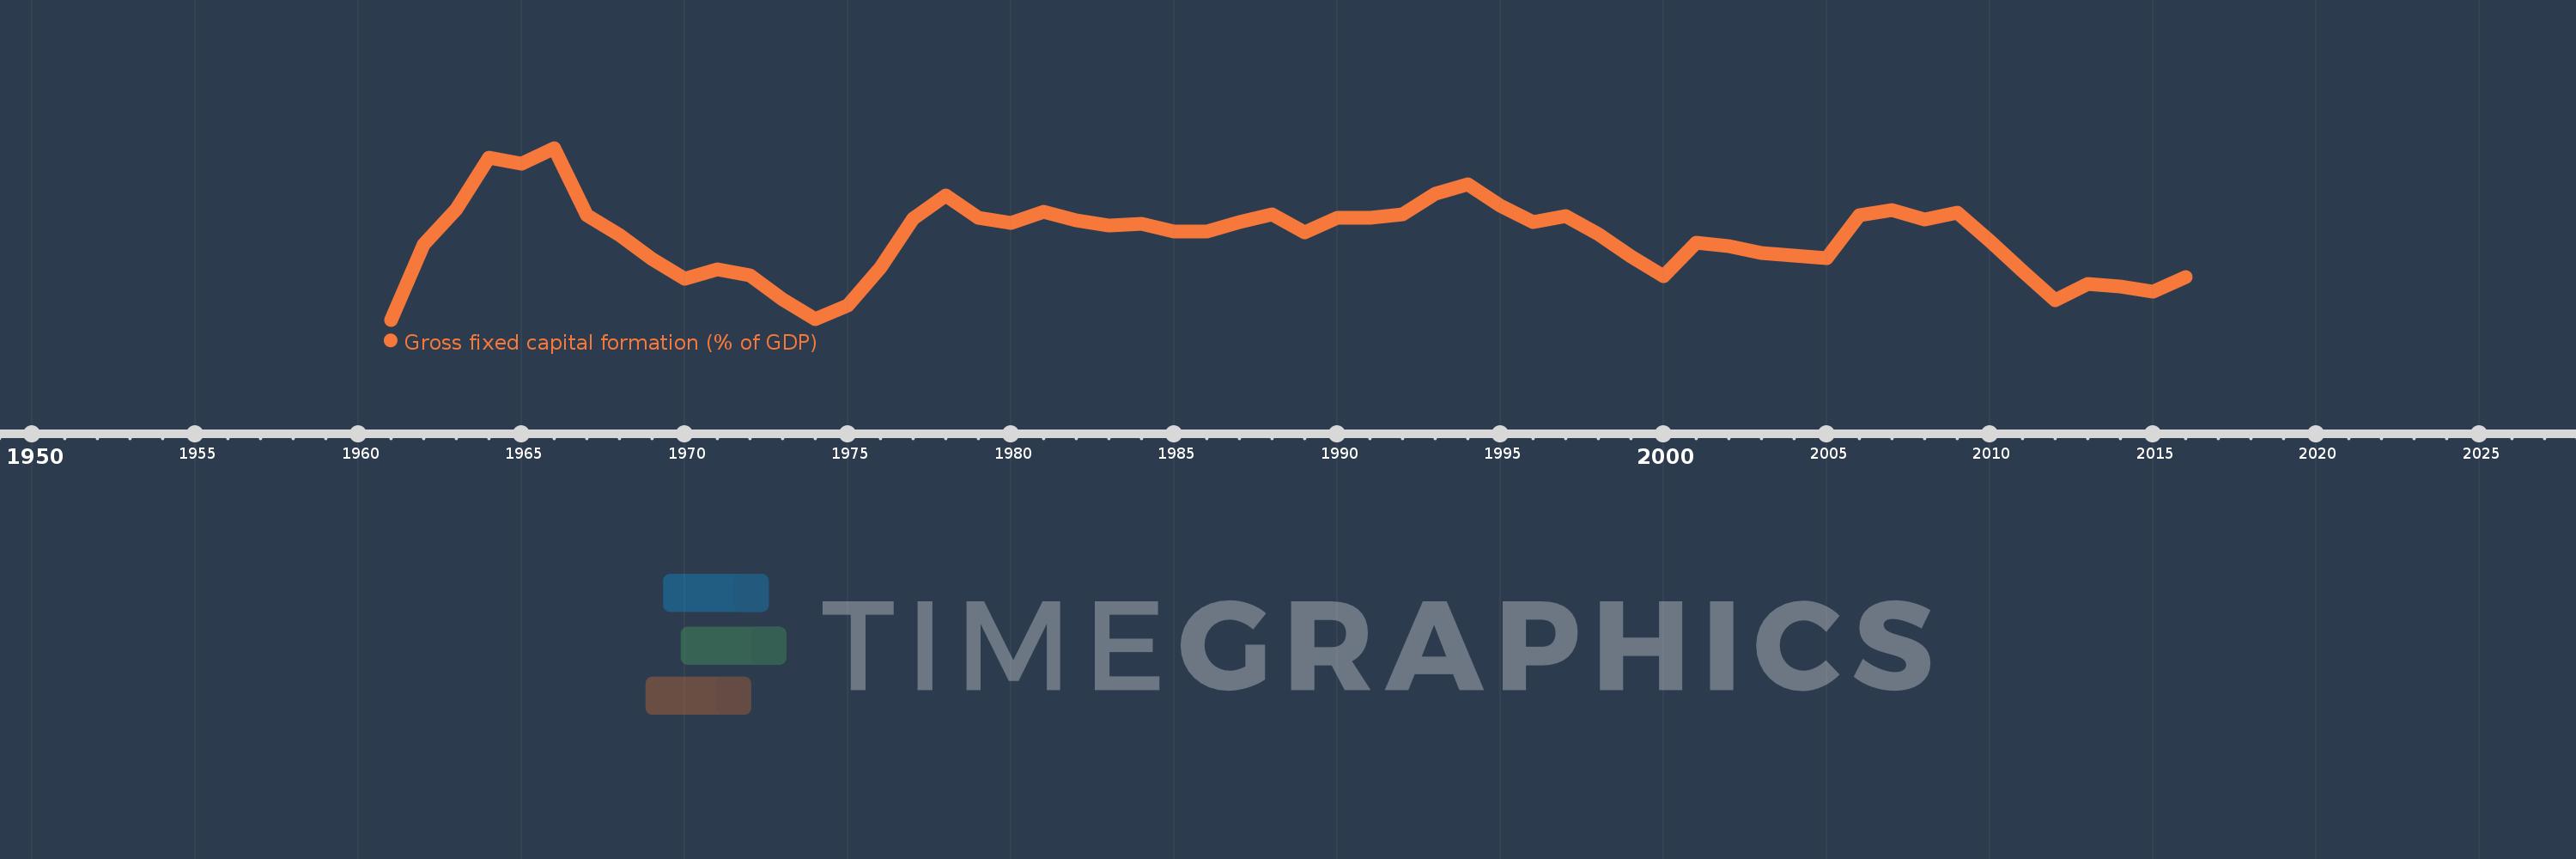
Gross fixed capital formation (% of GDP)
2016,2015,2014,2013,2012,2011,2010,2009,2008,2007,2006,2005,2004,2003,2002,2001,2000,1999,1998,1997,1996,1995,1994,1993,1992,1991,1990,1989,1988,1987,1986,1985,1984,1983,1982,1981,1980,1979,1978,1977,1976,1975,1974,1973,1972,1971,1970,1969,1968,1967,1966,1965,1964,1963,1962,1961
Queste statistiche in altri paesi:
AfghanistanAlbaniaAlgeriaAngolaAntigua and BarbudaArab WorldArgentinaArmeniaArubaAustraliaAustriaAzerbaijanBahamas, TheBahrainBangladeshBarbadosBelarusBelgiumBelizeBeninBermudaBhutanBoliviaBosnia and HerzegovinaBotswanaBrazilBrunei DarussalamBulgariaBurkina FasoBurundiCabo VerdeCambodiaCameroonCanadaCaribbean small statesCentral African RepublicCentral Europe and the BalticsChadChileChinaColombiaComorosCongo, Dem. Rep.Congo, Rep.Costa RicaCote d'IvoireCroatiaCubaCyprusCzech RepublicDenmarkDjiboutiDominicaDominican RepublicEarly-demographic dividendEast Asia & PacificEast Asia & Pacific (excluding high income)East Asia & Pacific (IDA & IBRD countries)EcuadorEgypt, Arab Rep.El SalvadorEquatorial GuineaEritreaEstoniaEthiopiaEuro areaEurope & Central AsiaEurope & Central Asia (excluding high income)Europe & Central Asia (IDA & IBRD countries)European UnionFijiFinlandFragile and conflict affected situationsFranceGabonGambia, TheGeorgiaGermanyGhanaGreeceGrenadaGuatemalaGuineaGuinea-BissauGuyanaHaitiHeavily indebted poor countries (HIPC)High incomeHondurasHong Kong SAR, ChinaHungaryIBRD onlyIcelandIDA & IBRD totalIDA blendIDA onlyIDA totalIndiaIndonesiaIran, Islamic Rep.IraqIrelandIsraelItalyJamaicaJapanJordanKazakhstanKenyaKiribatiKorea, Rep.KosovoKuwaitKyrgyz RepublicLao PDRLate-demographic dividendLatin America & Caribbean Latin America & Caribbean (excluding high income)Latin America & the Caribbean (IDA & IBRD countries)LatviaLeast developed countries: UN classificationLebanonLesothoLiberiaLibyaLithuaniaLow & middle incomeLow incomeLower middle incomeLuxembourgMacao SAR, ChinaMacedonia, FYRMadagascarMalawiMalaysiaMaldivesMaliMaltaMauritaniaMauritiusMexicoMicronesia, Fed. Sts.Middle East & North AfricaMiddle East & North Africa (excluding high income)Middle East & North Africa (IDA & IBRD countries)Middle incomeMoldovaMongoliaMontenegroMoroccoMozambiqueNamibiaNepalNetherlandsNew CaledoniaNew ZealandNicaraguaNigerNigeriaNorth AmericaNorwayOECD membersOmanPacific island small statesPakistanPanamaPapua New GuineaParaguayPeruPhilippinesPolandPortugalPost-demographic dividendPre-demographic dividendPuerto RicoRomaniaRussian FederationRwandaSaudi ArabiaSenegalSerbiaSeychellesSierra LeoneSingaporeSlovak RepublicSloveniaSolomon IslandsSomaliaSouth AfricaSouth AsiaSouth Asia (IDA & IBRD)South SudanSpainSri LankaSt. Kitts and NevisSt. LuciaSt. Vincent and the GrenadinesSub-Saharan Africa Sub-Saharan Africa (excluding high income)Sub-Saharan Africa (IDA & IBRD countries)SudanSurinameSwazilandSwedenSwitzerlandSyrian Arab RepublicTajikistanTanzaniaThailandTimor-LesteTogoTongaTrinidad and TobagoTunisiaTurkeyTurkmenistanUgandaUkraineUnited Arab EmiratesUnited KingdomUnited StatesUpper middle incomeUruguayUzbekistanVanuatuVenezuela, RBVietnamWest Bank and GazaWorldYemen, Rep.ZambiaZimbabwe Linea del tempo:
Questa scala temporale mostra un grafico dal 1961 anno al 2016 anno. Pakistan. I dati fino ad 1960 anno non disponibili. Il numero di osservazioni attuali secondo i date: 56.
La fonte (nome):
Indicatori dello sviluppo mondiale
La fonte (organizzazione):
World Bank national accounts data, and OECD National Accounts data files.
Categorie:
Economy & Growth
sono stati aggiornati
23 apr 2017 anni
Indicatori delle variazioni dei valori per anni
Minima:
11.415
1 gen 1961 anni
Massimo:
21.325
1 gen 1966 anni
Alla data di osservazione
Valore
Variazione assoluta
La variazione rispetto al valore precedente
1 gen 1961 anni
11.415
+11.415
0.0%
1 gen 1962 anni
15.776
+4.361
38.21%
1 gen 1963 anni
17.809
+2.033
12.89%
1 gen 1964 anni
20.789
+2.98
16.73%
1 gen 1965 anni
20.433
-0.356
-1.71%
1 gen 1966 anni
21.325
+0.892
4.37%
1 gen 1967 anni
17.422
-3.903
-18.3%
1 gen 1968 anni
16.303
-1.119
-6.42%
1 gen 1969 anni
14.905
-1.399
-8.58%
1 gen 1970 anni
13.78
-1.125
-7.54%
1 gen 1971 anni
14.312
+0.532
3.86%
1 gen 1972 anni
13.954
-0.358
-2.5%
1 gen 1973 anni
12.603
-1.351
-9.68%
1 gen 1974 anni
11.435
-1.168
-9.27%
1 gen 1975 anni
12.221
+0.786
6.87%
1 gen 1976 anni
14.446
+2.225
18.21%
1 gen 1977 anni
17.243
+2.797
19.36%
1 gen 1978 anni
18.602
+1.359
7.88%
1 gen 1979 anni
17.291
-1.311
-7.05%
1 gen 1980 anni
16.978
-0.313
-1.81%
1 gen 1981 anni
17.629
+0.651
3.83%
1 gen 1982 anni
17.157
-0.472
-2.68%
1 gen 1983 anni
16.837
-0.32
-1.86%
1 gen 1984 anni
16.961
+0.124
0.73%
1 gen 1985 anni
16.484
-0.477
-2.81%
1 gen 1986 anni
16.499
+0.015
0.09%
1 gen 1987 anni
17.025
+0.526
3.19%
1 gen 1988 anni
17.475
+0.45
2.64%
1 gen 1989 anni
16.474
-1.001
-5.73%
1 gen 1990 anni
17.301
+0.826
5.01%
1 gen 1991 anni
17.3
-0.001
0.0%
1 gen 1992 anni
17.472
+0.173
1.0%
1 gen 1993 anni
18.685
+1.213
6.94%
1 gen 1994 anni
19.235
+0.55
2.95%
1 gen 1995 anni
17.971
-1.265
-6.58%
1 gen 1996 anni
17.034
-0.936
-5.21%
1 gen 1997 anni
17.377
+0.343
2.01%
1 gen 1998 anni
16.343
-1.034
-5.95%
1 gen 1999 anni
15.045
-1.298
-7.94%
1 gen 2000 anni
13.931
-1.113
-7.4%
1 gen 2001 anni
15.875
+1.944
13.95%
1 gen 2002 anni
15.661
-0.214
-1.35%
1 gen 2003 anni
15.28
-0.381
-2.43%
1 gen 2004 anni
15.104
-0.176
-1.15%
1 gen 2005 anni
14.978
-0.126
-0.84%
1 gen 2006 anni
17.461
+2.483
16.58%
1 gen 2007 anni
17.732
+0.271
1.55%
1 gen 2008 anni
17.187
-0.545
-3.07%
1 gen 2009 anni
17.606
+0.419
2.44%
1 gen 2010 anni
15.949
-1.656
-9.41%
1 gen 2011 anni
14.205
-1.745
-10.94%
1 gen 2012 anni
12.521
-1.684
-11.85%
1 gen 2013 anni
13.476
+0.955
7.63%
1 gen 2014 anni
13.357
-0.119
-0.88%
1 gen 2015 anni
13.035
-0.322
-2.41%
1 gen 2016 anni
13.879
+0.844
6.47%
Classificazione dei paesi secondo i statistiche attuali per anni


Commenti: