29
/it/
it
AIzaSyAYiBZKx7MnpbEhh9jyipgxe19OcubqV5w
April 1, 2024
151633
Hong Kong SAR, China
HKG
true
2
1
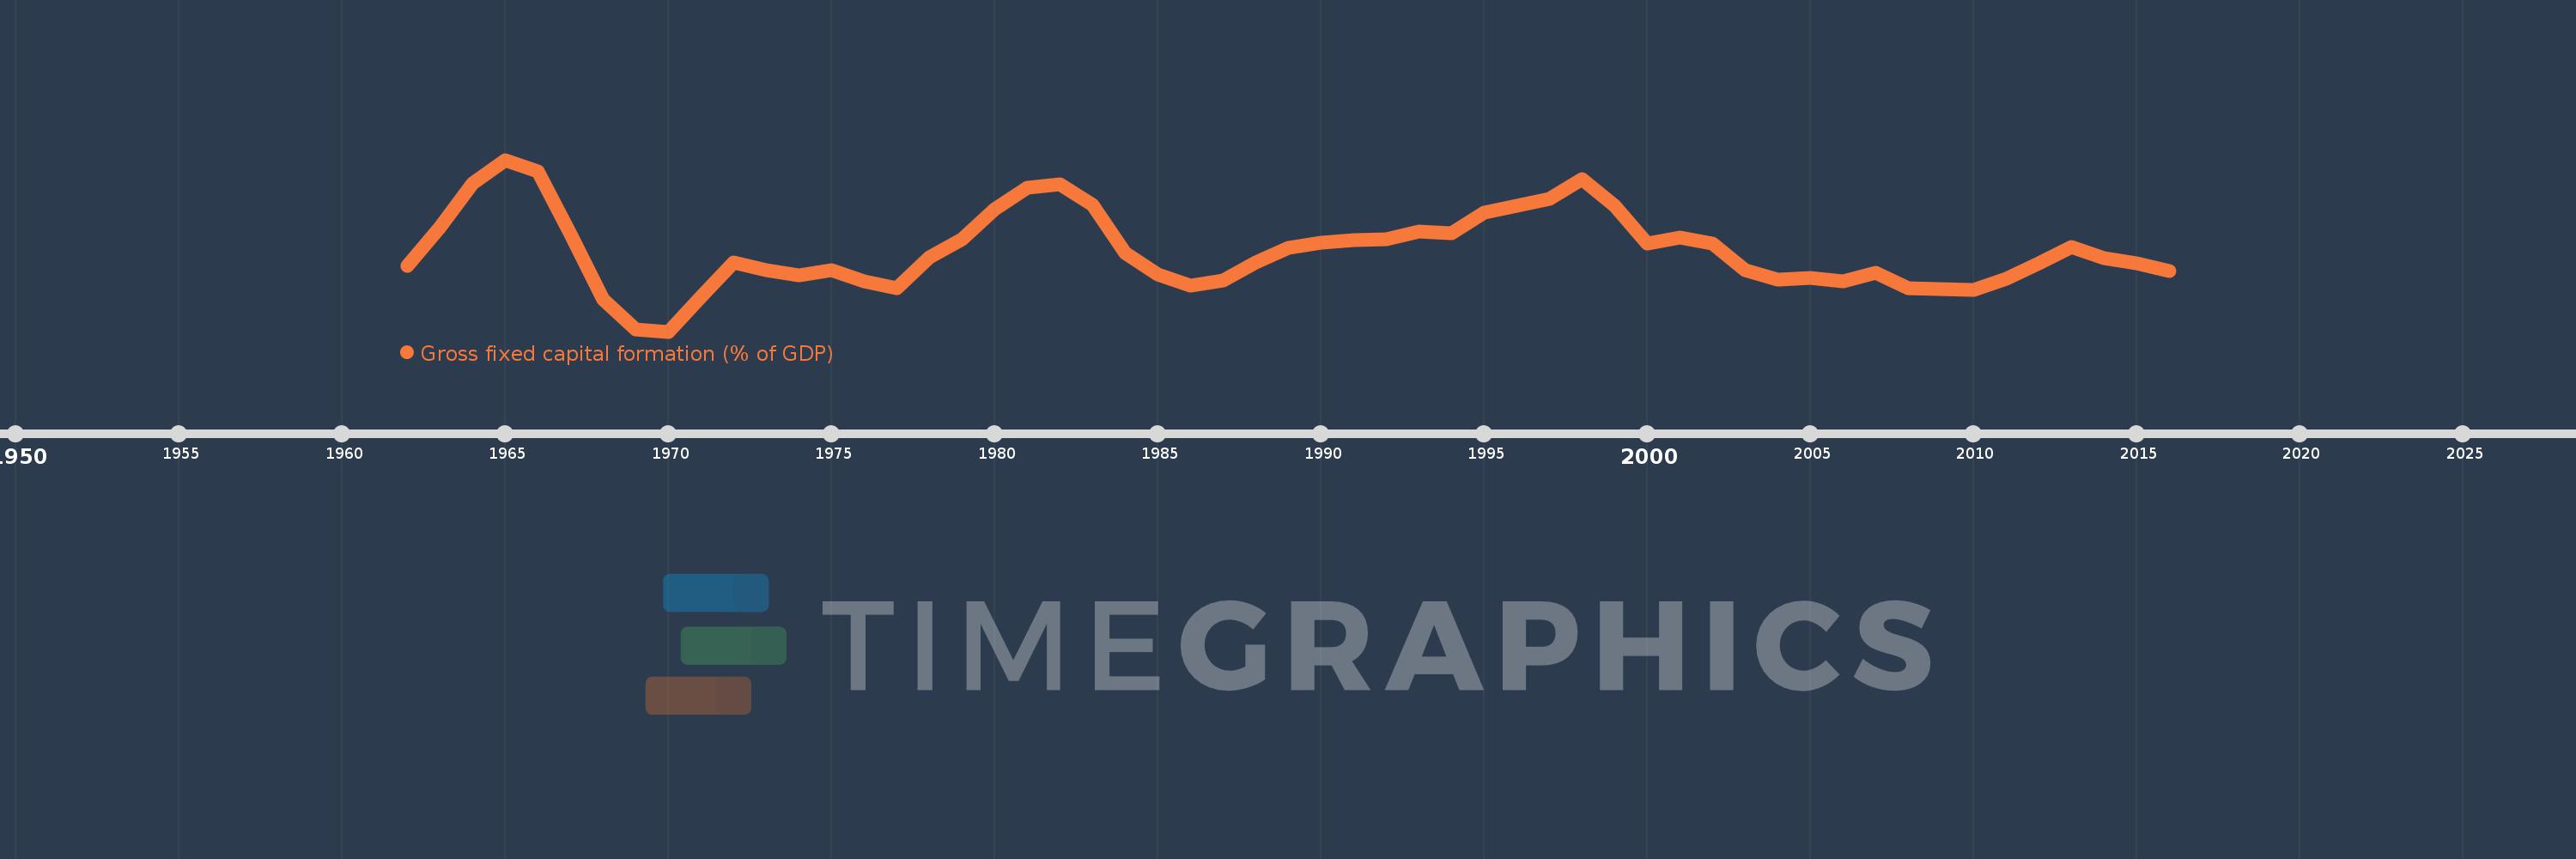
Gross fixed capital formation (% of GDP)
2016,2015,2014,2013,2012,2011,2010,2009,2008,2007,2006,2005,2004,2003,2002,2001,2000,1999,1998,1997,1996,1995,1994,1993,1992,1991,1990,1989,1988,1987,1986,1985,1984,1983,1982,1981,1980,1979,1978,1977,1976,1975,1974,1973,1972,1971,1970,1969,1968,1967,1966,1965,1964,1963,1962
Queste statistiche in altri paesi:
AfghanistanAlbaniaAlgeriaAngolaAntigua and BarbudaArab WorldArgentinaArmeniaArubaAustraliaAustriaAzerbaijanBahamas, TheBahrainBangladeshBarbadosBelarusBelgiumBelizeBeninBermudaBhutanBoliviaBosnia and HerzegovinaBotswanaBrazilBrunei DarussalamBulgariaBurkina FasoBurundiCabo VerdeCambodiaCameroonCanadaCaribbean small statesCentral African RepublicCentral Europe and the BalticsChadChileChinaColombiaComorosCongo, Dem. Rep.Congo, Rep.Costa RicaCote d'IvoireCroatiaCubaCyprusCzech RepublicDenmarkDjiboutiDominicaDominican RepublicEarly-demographic dividendEast Asia & PacificEast Asia & Pacific (excluding high income)East Asia & Pacific (IDA & IBRD countries)EcuadorEgypt, Arab Rep.El SalvadorEquatorial GuineaEritreaEstoniaEthiopiaEuro areaEurope & Central AsiaEurope & Central Asia (excluding high income)Europe & Central Asia (IDA & IBRD countries)European UnionFijiFinlandFragile and conflict affected situationsFranceGabonGambia, TheGeorgiaGermanyGhanaGreeceGrenadaGuatemalaGuineaGuinea-BissauGuyanaHaitiHeavily indebted poor countries (HIPC)High incomeHondurasHong Kong SAR, ChinaHungaryIBRD onlyIcelandIDA & IBRD totalIDA blendIDA onlyIDA totalIndiaIndonesiaIran, Islamic Rep.IraqIrelandIsraelItalyJamaicaJapanJordanKazakhstanKenyaKiribatiKorea, Rep.KosovoKuwaitKyrgyz RepublicLao PDRLate-demographic dividendLatin America & Caribbean Latin America & Caribbean (excluding high income)Latin America & the Caribbean (IDA & IBRD countries)LatviaLeast developed countries: UN classificationLebanonLesothoLiberiaLibyaLithuaniaLow & middle incomeLow incomeLower middle incomeLuxembourgMacao SAR, ChinaMacedonia, FYRMadagascarMalawiMalaysiaMaldivesMaliMaltaMauritaniaMauritiusMexicoMicronesia, Fed. Sts.Middle East & North AfricaMiddle East & North Africa (excluding high income)Middle East & North Africa (IDA & IBRD countries)Middle incomeMoldovaMongoliaMontenegroMoroccoMozambiqueNamibiaNepalNetherlandsNew CaledoniaNew ZealandNicaraguaNigerNigeriaNorth AmericaNorwayOECD membersOmanPacific island small statesPakistanPanamaPapua New GuineaParaguayPeruPhilippinesPolandPortugalPost-demographic dividendPre-demographic dividendPuerto RicoRomaniaRussian FederationRwandaSaudi ArabiaSenegalSerbiaSeychellesSierra LeoneSingaporeSlovak RepublicSloveniaSolomon IslandsSomaliaSouth AfricaSouth AsiaSouth Asia (IDA & IBRD)South SudanSpainSri LankaSt. Kitts and NevisSt. LuciaSt. Vincent and the GrenadinesSub-Saharan Africa Sub-Saharan Africa (excluding high income)Sub-Saharan Africa (IDA & IBRD countries)SudanSurinameSwazilandSwedenSwitzerlandSyrian Arab RepublicTajikistanTanzaniaThailandTimor-LesteTogoTongaTrinidad and TobagoTunisiaTurkeyTurkmenistanUgandaUkraineUnited Arab EmiratesUnited KingdomUnited StatesUpper middle incomeUruguayUzbekistanVanuatuVenezuela, RBVietnamWest Bank and GazaWorldYemen, Rep.ZambiaZimbabwe Linea del tempo:
Questa scala temporale mostra un grafico dal 1962 anno al 2016 anno. Hong Kong SAR, China. I dati fino ad 1961 anno non disponibili. Il numero di osservazioni attuali secondo i date: 55.
La fonte (nome):
Indicatori dello sviluppo mondiale
La fonte (organizzazione):
World Bank national accounts data, and OECD National Accounts data files.
Categorie:
Economy & Growth
sono stati aggiornati
23 apr 2017 anni
Indicatori delle variazioni dei valori per anni
Minima:
15.62
1 gen 1970 anni
Massimo:
35.506
1 gen 1965 anni
Alla data di osservazione
Valore
Variazione assoluta
La variazione rispetto al valore precedente
1 gen 1962 anni
23.246
+23.246
0.0%
1 gen 1963 anni
27.708
+4.462
19.19%
1 gen 1964 anni
32.752
+5.043
18.2%
1 gen 1965 anni
35.506
+2.755
8.41%
1 gen 1966 anni
34.158
-1.349
-3.8%
1 gen 1967 anni
26.894
-7.264
-21.26%
1 gen 1968 anni
19.367
-7.527
-27.99%
1 gen 1969 anni
15.877
-3.489
-18.02%
1 gen 1970 anni
15.62
-0.258
-1.62%
1 gen 1971 anni
19.666
+4.046
25.9%
1 gen 1972 anni
23.605
+3.939
20.03%
1 gen 1973 anni
22.686
-0.918
-3.89%
1 gen 1974 anni
22.15
-0.536
-2.36%
1 gen 1975 anni
22.748
+0.598
2.7%
1 gen 1976 anni
21.473
-1.275
-5.61%
1 gen 1977 anni
20.665
-0.808
-3.76%
1 gen 1978 anni
24.199
+3.534
17.1%
1 gen 1979 anni
26.32
+2.121
8.77%
1 gen 1980 anni
29.746
+3.426
13.02%
1 gen 1981 anni
32.246
+2.5
8.4%
1 gen 1982 anni
32.662
+0.416
1.29%
1 gen 1983 anni
30.268
-2.394
-7.33%
1 gen 1984 anni
24.677
-5.59
-18.47%
1 gen 1985 anni
22.203
-2.474
-10.03%
1 gen 1986 anni
20.972
-1.231
-5.54%
1 gen 1987 anni
21.503
+0.531
2.53%
1 gen 1988 anni
23.599
+2.096
9.75%
1 gen 1989 anni
25.32
+1.721
7.29%
1 gen 1990 anni
25.878
+0.558
2.2%
1 gen 1991 anni
26.215
+0.337
1.3%
1 gen 1992 anni
26.329
+0.114
0.43%
1 gen 1993 anni
27.163
+0.834
3.17%
1 gen 1994 anni
27.003
-0.16
-0.59%
1 gen 1995 anni
29.353
+2.351
8.7%
1 gen 1996 anni
30.211
+0.857
2.92%
1 gen 1997 anni
31.01
+0.799
2.65%
1 gen 1998 anni
33.303
+2.293
7.4%
1 gen 1999 anni
30.2
-3.103
-9.32%
1 gen 2000 anni
25.805
-4.396
-14.55%
1 gen 2001 anni
26.506
+0.701
2.72%
1 gen 2002 anni
25.799
-0.707
-2.67%
1 gen 2003 anni
22.745
-3.054
-11.84%
1 gen 2004 anni
21.655
-1.09
-4.79%
1 gen 2005 anni
21.82
+0.166
0.76%
1 gen 2006 anni
21.397
-0.423
-1.94%
1 gen 2007 anni
22.427
+1.03
4.81%
1 gen 2008 anni
20.618
-1.809
-8.06%
1 gen 2009 anni
20.545
-0.074
-0.36%
1 gen 2010 anni
20.464
-0.08
-0.39%
1 gen 2011 anni
21.778
+1.314
6.42%
1 gen 2012 anni
23.536
+1.758
8.07%
1 gen 2013 anni
25.4
+1.864
7.92%
1 gen 2014 anni
24.112
-1.288
-5.07%
1 gen 2015 anni
23.513
-0.598
-2.48%
1 gen 2016 anni
22.677
-0.837
-3.56%
Classificazione dei paesi secondo i statistiche attuali per anni


Commenti: