29
/it/
it
AIzaSyAYiBZKx7MnpbEhh9jyipgxe19OcubqV5w
April 1, 2024
64699
Albania
ALB
true
2
1
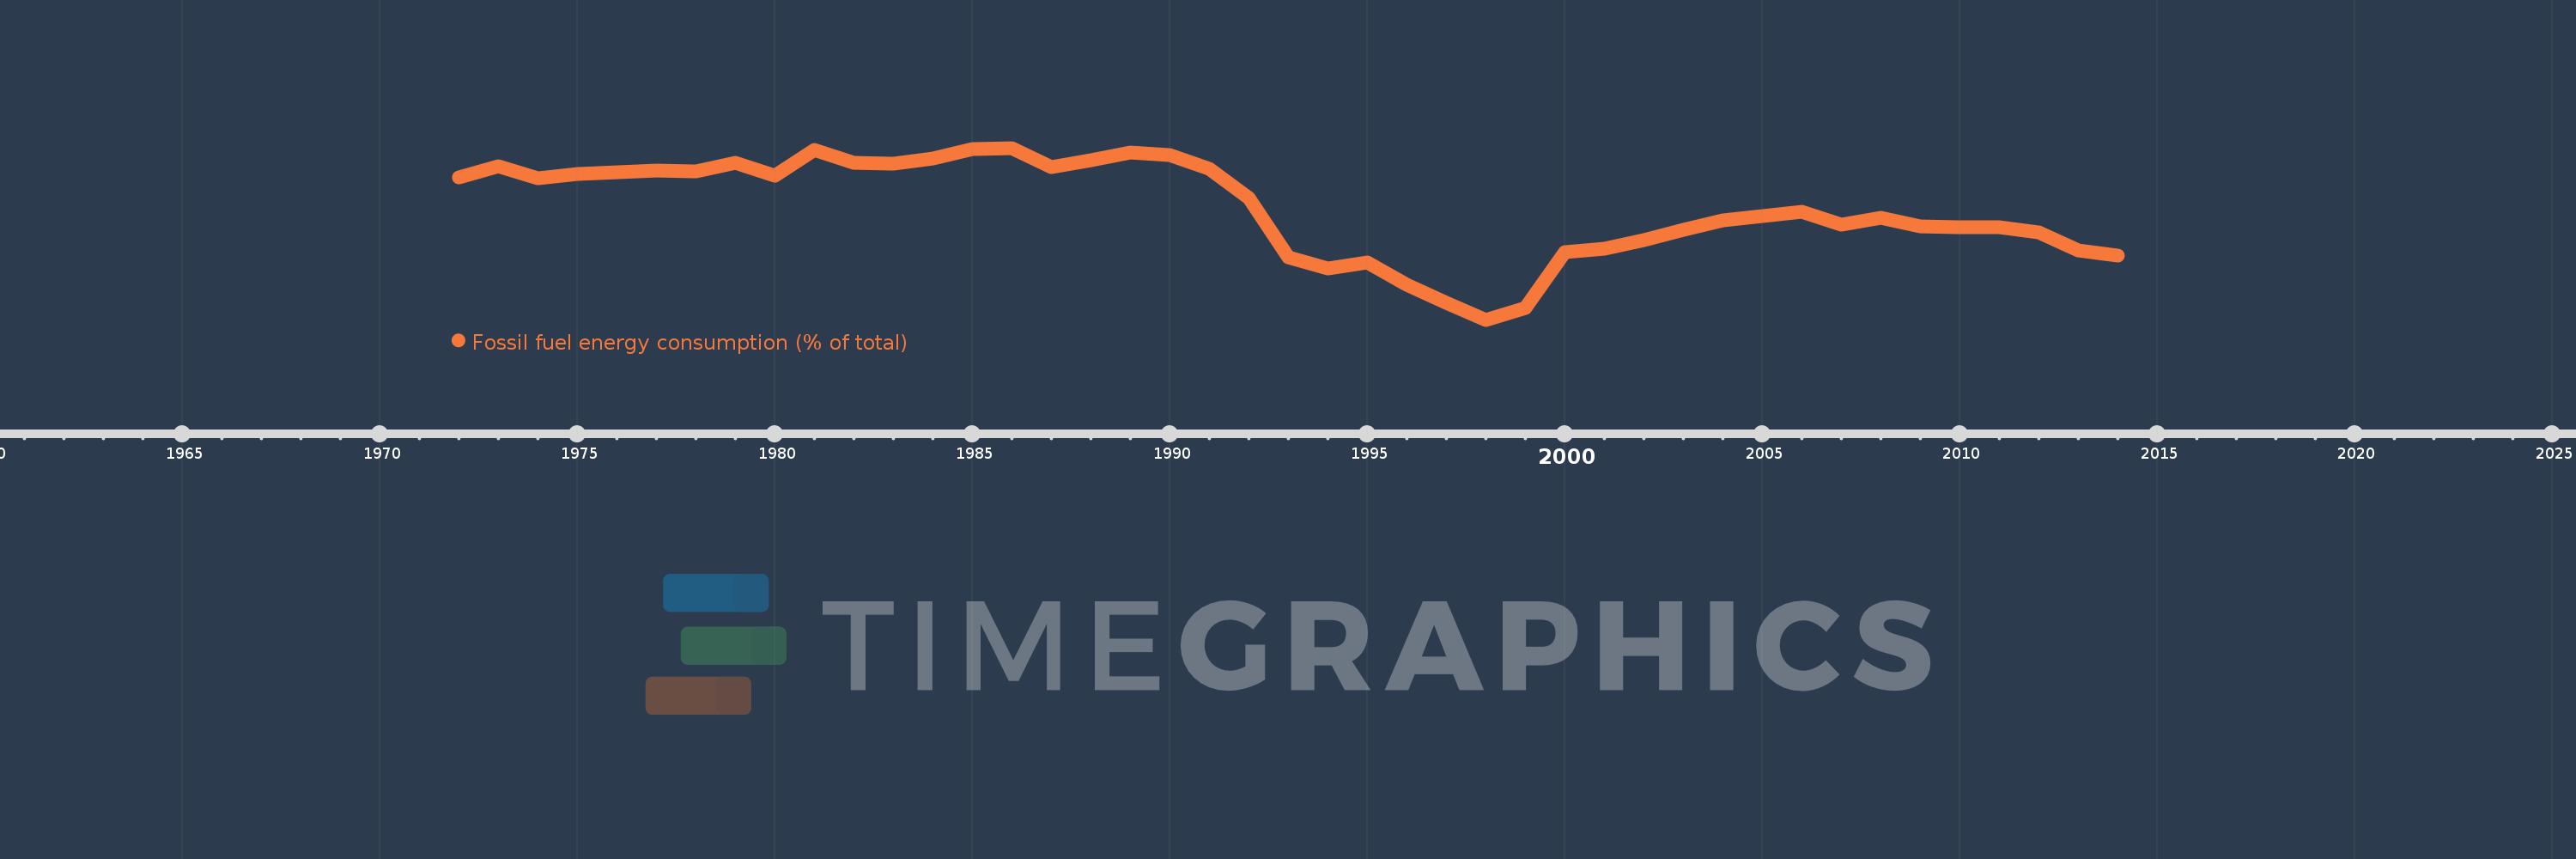
Fossil fuel energy consumption (% of total)
2014,2013,2012,2011,2010,2009,2008,2007,2006,2005,2004,2003,2002,2001,2000,1999,1998,1997,1996,1995,1994,1993,1992,1991,1990,1989,1988,1987,1986,1985,1984,1983,1982,1981,1980,1979,1978,1977,1976,1975,1974,1973,1972
Queste statistiche in altri paesi:
AlbaniaAlgeriaAngolaAntigua and BarbudaArab WorldArgentinaArmeniaAustraliaAustriaAzerbaijanBahamas, TheBahrainBangladeshBarbadosBelarusBelgiumBelizeBeninBhutanBoliviaBosnia and HerzegovinaBotswanaBrazilBrunei DarussalamBulgariaCabo VerdeCambodiaCameroonCanadaCaribbean small statesCentral Europe and the BalticsChileChinaColombiaComorosCongo, Dem. Rep.Congo, Rep.Costa RicaCote d'IvoireCroatiaCubaCuracaoCyprusCzech RepublicDenmarkDjiboutiDominicaDominican RepublicEarly-demographic dividendEast Asia & PacificEast Asia & Pacific (excluding high income)East Asia & Pacific (IDA & IBRD countries)EcuadorEgypt, Arab Rep.El SalvadorEquatorial GuineaEritreaEstoniaEthiopiaEuro areaEurope & Central AsiaEurope & Central Asia (excluding high income)Europe & Central Asia (IDA & IBRD countries)European UnionFijiFinlandFragile and conflict affected situationsFranceGabonGambia, TheGeorgiaGermanyGhanaGibraltarGreeceGrenadaGuatemalaGuinea-BissauGuyanaHaitiHeavily indebted poor countries (HIPC)High incomeHondurasHong Kong SAR, ChinaHungaryIBRD onlyIcelandIDA & IBRD totalIDA blendIDA onlyIDA totalIndiaIndonesiaIran, Islamic Rep.IraqIrelandIsraelItalyJamaicaJapanJordanKazakhstanKenyaKiribatiKorea, Dem. People’s Rep.Korea, Rep.KosovoKuwaitKyrgyz RepublicLate-demographic dividendLatin America & Caribbean Latin America & Caribbean (excluding high income)Latin America & the Caribbean (IDA & IBRD countries)LatviaLeast developed countries: UN classificationLebanonLesothoLibyaLithuaniaLow & middle incomeLow incomeLower middle incomeLuxembourgMacedonia, FYRMalaysiaMaldivesMaltaMarshall IslandsMauritiusMexicoMiddle East & North AfricaMiddle East & North Africa (excluding high income)Middle East & North Africa (IDA & IBRD countries)Middle incomeMoldovaMongoliaMontenegroMoroccoMozambiqueMyanmarNamibiaNepalNetherlandsNew ZealandNicaraguaNigerNigeriaNorth AmericaNorwayOECD membersOmanOther small statesPacific island small statesPakistanPalauPanamaParaguayPeruPhilippinesPolandPortugalPost-demographic dividendPre-demographic dividendQatarRomaniaRussian FederationSamoaSao Tome and PrincipeSaudi ArabiaSenegalSerbiaSeychellesSingaporeSlovak RepublicSloveniaSmall statesSolomon IslandsSouth AfricaSouth AsiaSouth Asia (IDA & IBRD)South SudanSpainSri LankaSt. Kitts and NevisSt. LuciaSt. Vincent and the GrenadinesSub-Saharan Africa Sub-Saharan Africa (excluding high income)Sub-Saharan Africa (IDA & IBRD countries)SudanSurinameSwazilandSwedenSwitzerlandSyrian Arab RepublicTajikistanTanzaniaThailandTimor-LesteTogoTongaTrinidad and TobagoTunisiaTurkeyUkraineUnited Arab EmiratesUnited KingdomUnited StatesUpper middle incomeUruguayUzbekistanVanuatuVenezuela, RBVietnamWorldYemen, Rep.ZambiaZimbabwe Linea del tempo:
Questa scala temporale mostra un grafico dal 1972 anno al 2014 anno. Albania. I dati fino ad 1971 anno non disponibili. Il numero di osservazioni attuali secondo i date: 43.
La fonte (nome):
Indicatori dello sviluppo mondiale
La fonte (organizzazione):
IEA Statistics © OECD/IEA 2014 (http://www.iea.org/stats/index.asp), subject to https://www.iea.org/t&c/termsandconditions/
Categorie:
Energy & Mining
sono stati aggiornati
23 apr 2017 anni
Indicatori delle variazioni dei valori per anni
Minima:
41.449
1 gen 1998 anni
Massimo:
81.434
1 gen 1986 anni
Alla data di osservazione
Valore
Variazione assoluta
La variazione rispetto al valore precedente
1 gen 1972 anni
74.661
+74.661
0.0%
1 gen 1973 anni
77.174
+2.513
3.37%
1 gen 1974 anni
74.367
-2.807
-3.64%
1 gen 1975 anni
75.397
+1.031
1.39%
1 gen 1976 anni
75.746
+0.349
0.46%
1 gen 1977 anni
76.194
+0.447
0.59%
1 gen 1978 anni
75.882
-0.312
-0.41%
1 gen 1979 anni
78.025
+2.143
2.82%
1 gen 1980 anni
75.012
-3.013
-3.86%
1 gen 1981 anni
80.929
+5.917
7.89%
1 gen 1982 anni
78.038
-2.891
-3.57%
1 gen 1983 anni
77.837
-0.201
-0.26%
1 gen 1984 anni
78.876
+1.039
1.34%
1 gen 1985 anni
81.097
+2.222
2.82%
1 gen 1986 anni
81.434
+0.336
0.41%
1 gen 1987 anni
77.058
-4.375
-5.37%
1 gen 1988 anni
78.638
+1.579
2.05%
1 gen 1989 anni
80.381
+1.744
2.22%
1 gen 1990 anni
79.694
-0.688
-0.86%
1 gen 1991 anni
76.594
-3.1
-3.89%
1 gen 1992 anni
69.825
-6.769
-8.84%
1 gen 1993 anni
56.079
-13.746
-19.69%
1 gen 1994 anni
53.479
-2.6
-4.64%
1 gen 1995 anni
54.847
+1.368
2.56%
1 gen 1996 anni
49.542
-5.305
-9.67%
1 gen 1997 anni
45.454
-4.088
-8.25%
1 gen 1998 anni
41.449
-4.004
-8.81%
1 gen 1999 anni
44.095
+2.645
6.38%
1 gen 2000 anni
57.17
+13.075
29.65%
1 gen 2001 anni
58.017
+0.848
1.48%
1 gen 2002 anni
59.972
+1.955
3.37%
1 gen 2003 anni
62.38
+2.407
4.01%
1 gen 2004 anni
64.528
+2.148
3.44%
1 gen 2005 anni
65.578
+1.05
1.63%
1 gen 2006 anni
66.487
+0.908
1.39%
1 gen 2007 anni
63.551
-2.936
-4.42%
1 gen 2008 anni
65.122
+1.572
2.47%
1 gen 2009 anni
63.134
-1.988
-3.05%
1 gen 2010 anni
62.929
-0.205
-0.33%
1 gen 2011 anni
63.006
+0.077
0.12%
1 gen 2012 anni
61.766
-1.24
-1.97%
1 gen 2013 anni
57.632
-4.133
-6.69%
1 gen 2014 anni
56.377
-1.255
-2.18%
Classificazione dei paesi secondo i statistiche attuali per anni


Commenti: