29
/it/
it
AIzaSyAYiBZKx7MnpbEhh9jyipgxe19OcubqV5w
April 1, 2024
159398
Ireland
IRL
true
2
1
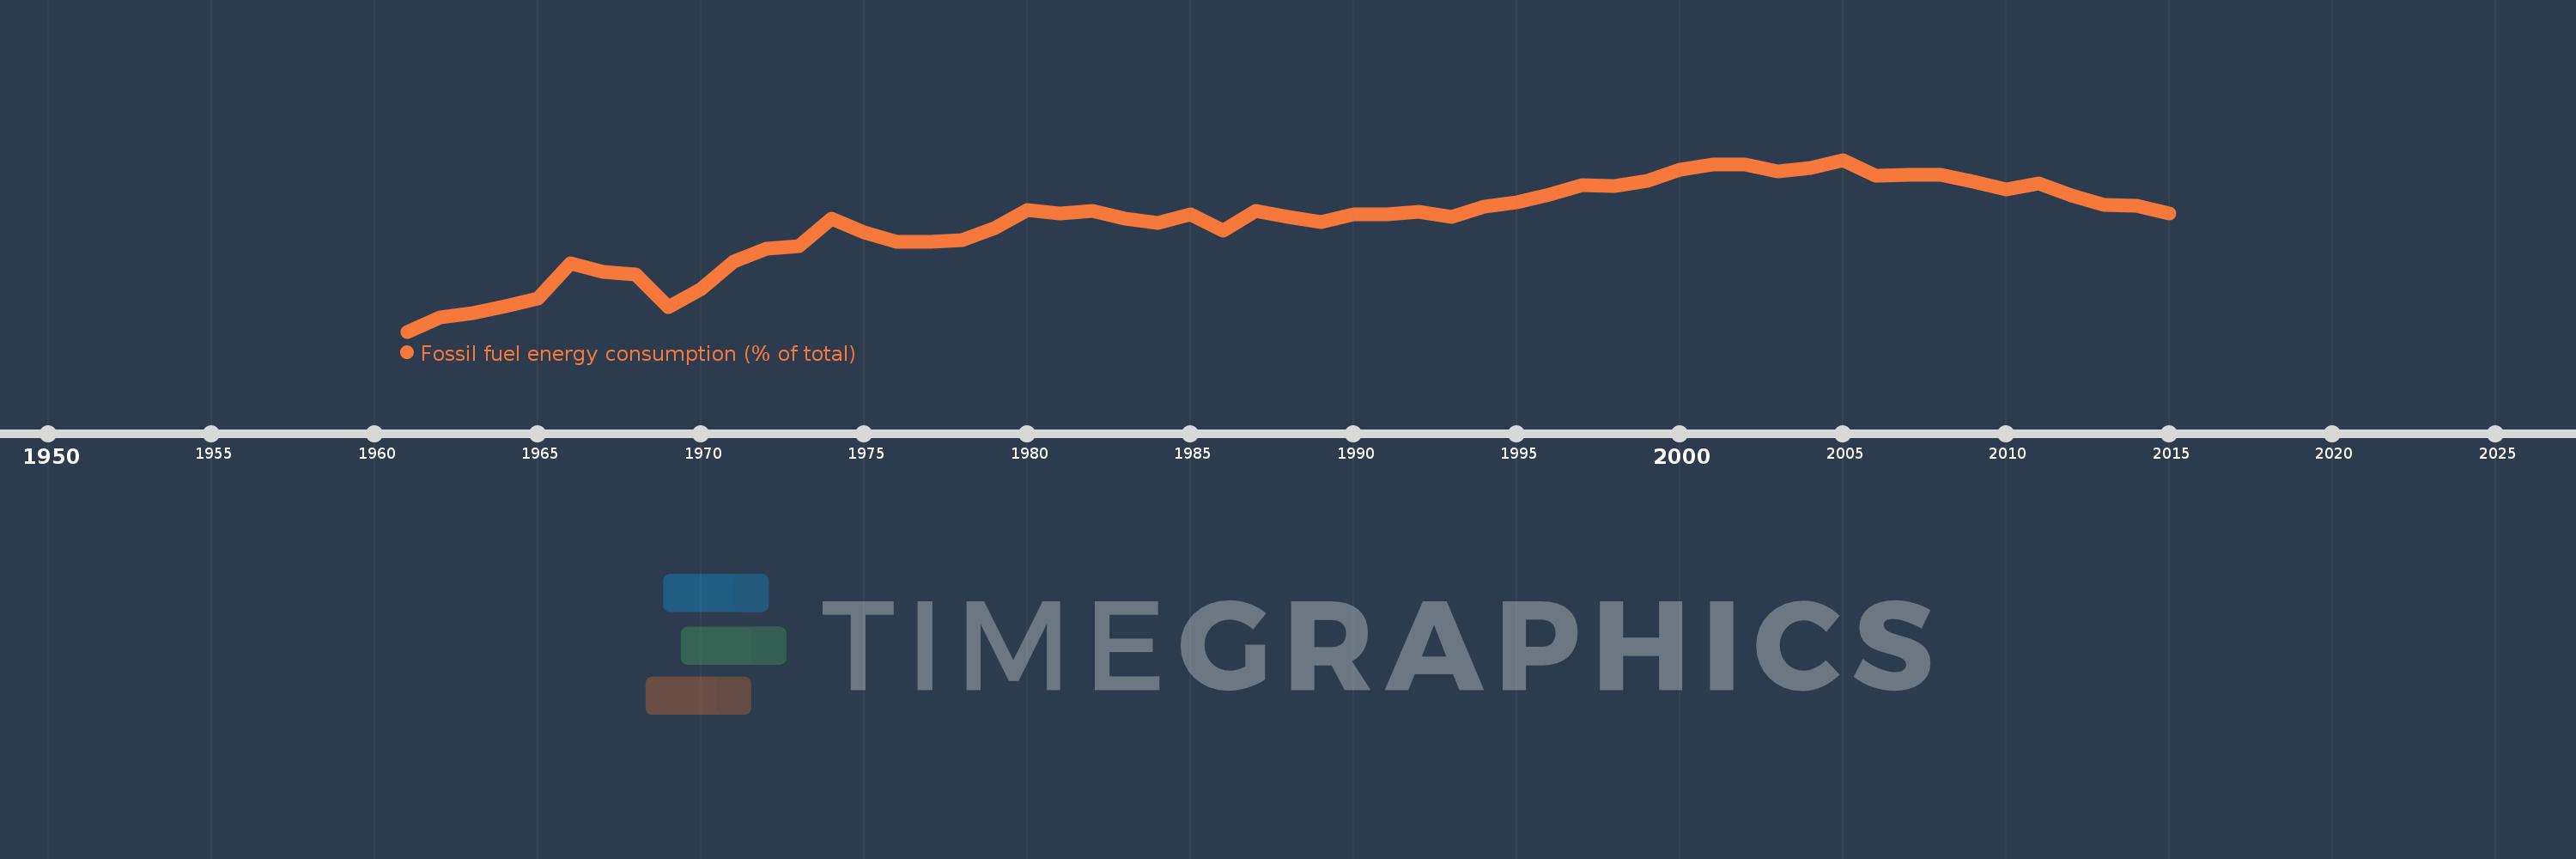
Fossil fuel energy consumption (% of total)
2015,2014,2013,2012,2011,2010,2009,2008,2007,2006,2005,2004,2003,2002,2001,2000,1999,1998,1997,1996,1995,1994,1993,1992,1991,1990,1989,1988,1987,1986,1985,1984,1983,1982,1981,1980,1979,1978,1977,1976,1975,1974,1973,1972,1971,1970,1969,1968,1967,1966,1965,1964,1963,1962,1961
Queste statistiche in altri paesi:
AlbaniaAlgeriaAngolaAntigua and BarbudaArab WorldArgentinaArmeniaAustraliaAustriaAzerbaijanBahamas, TheBahrainBangladeshBarbadosBelarusBelgiumBelizeBeninBhutanBoliviaBosnia and HerzegovinaBotswanaBrazilBrunei DarussalamBulgariaCabo VerdeCambodiaCameroonCanadaCaribbean small statesCentral Europe and the BalticsChileChinaColombiaComorosCongo, Dem. Rep.Congo, Rep.Costa RicaCote d'IvoireCroatiaCubaCuracaoCyprusCzech RepublicDenmarkDjiboutiDominicaDominican RepublicEarly-demographic dividendEast Asia & PacificEast Asia & Pacific (excluding high income)East Asia & Pacific (IDA & IBRD countries)EcuadorEgypt, Arab Rep.El SalvadorEquatorial GuineaEritreaEstoniaEthiopiaEuro areaEurope & Central AsiaEurope & Central Asia (excluding high income)Europe & Central Asia (IDA & IBRD countries)European UnionFijiFinlandFragile and conflict affected situationsFranceGabonGambia, TheGeorgiaGermanyGhanaGibraltarGreeceGrenadaGuatemalaGuinea-BissauGuyanaHaitiHeavily indebted poor countries (HIPC)High incomeHondurasHong Kong SAR, ChinaHungaryIBRD onlyIcelandIDA & IBRD totalIDA blendIDA onlyIDA totalIndiaIndonesiaIran, Islamic Rep.IraqIrelandIsraelItalyJamaicaJapanJordanKazakhstanKenyaKiribatiKorea, Dem. People’s Rep.Korea, Rep.KosovoKuwaitKyrgyz RepublicLate-demographic dividendLatin America & Caribbean Latin America & Caribbean (excluding high income)Latin America & the Caribbean (IDA & IBRD countries)LatviaLeast developed countries: UN classificationLebanonLesothoLibyaLithuaniaLow & middle incomeLow incomeLower middle incomeLuxembourgMacedonia, FYRMalaysiaMaldivesMaltaMarshall IslandsMauritiusMexicoMiddle East & North AfricaMiddle East & North Africa (excluding high income)Middle East & North Africa (IDA & IBRD countries)Middle incomeMoldovaMongoliaMontenegroMoroccoMozambiqueMyanmarNamibiaNepalNetherlandsNew ZealandNicaraguaNigerNigeriaNorth AmericaNorwayOECD membersOmanOther small statesPacific island small statesPakistanPalauPanamaParaguayPeruPhilippinesPolandPortugalPost-demographic dividendPre-demographic dividendQatarRomaniaRussian FederationSamoaSao Tome and PrincipeSaudi ArabiaSenegalSerbiaSeychellesSingaporeSlovak RepublicSloveniaSmall statesSolomon IslandsSouth AfricaSouth AsiaSouth Asia (IDA & IBRD)South SudanSpainSri LankaSt. Kitts and NevisSt. LuciaSt. Vincent and the GrenadinesSub-Saharan Africa Sub-Saharan Africa (excluding high income)Sub-Saharan Africa (IDA & IBRD countries)SudanSurinameSwazilandSwedenSwitzerlandSyrian Arab RepublicTajikistanTanzaniaThailandTimor-LesteTogoTongaTrinidad and TobagoTunisiaTurkeyUkraineUnited Arab EmiratesUnited KingdomUnited StatesUpper middle incomeUruguayUzbekistanVanuatuVenezuela, RBVietnamWorldYemen, Rep.ZambiaZimbabwe Linea del tempo:
Questa scala temporale mostra un grafico dal 1961 anno al 2015 anno. Ireland. I dati fino ad 1960 anno non disponibili. Il numero di osservazioni attuali secondo i date: 55.
La fonte (nome):
Indicatori dello sviluppo mondiale
La fonte (organizzazione):
IEA Statistics © OECD/IEA 2014 (http://www.iea.org/stats/index.asp), subject to https://www.iea.org/t&c/termsandconditions/
Categorie:
Energy & Mining
sono stati aggiornati
23 apr 2017 anni
Indicatori delle variazioni dei valori per anni
Minima:
67.242
1 gen 1961 anni
Massimo:
93.277
1 gen 2005 anni
Alla data di osservazione
Valore
Variazione assoluta
La variazione rispetto al valore precedente
1 gen 1961 anni
67.242
+67.242
0.0%
1 gen 1962 anni
69.44
+2.199
3.27%
1 gen 1963 anni
70.086
+0.645
0.93%
1 gen 1964 anni
71.112
+1.026
1.46%
1 gen 1965 anni
72.286
+1.174
1.65%
1 gen 1966 anni
77.57
+5.283
7.31%
1 gen 1967 anni
76.291
-1.279
-1.65%
1 gen 1968 anni
75.937
-0.354
-0.46%
1 gen 1969 anni
70.952
-4.985
-6.57%
1 gen 1970 anni
73.665
+2.713
3.82%
1 gen 1971 anni
77.862
+4.197
5.7%
1 gen 1972 anni
79.792
+1.93
2.48%
1 gen 1973 anni
80.257
+0.465
0.58%
1 gen 1974 anni
84.379
+4.122
5.14%
1 gen 1975 anni
82.301
-2.078
-2.46%
1 gen 1976 anni
80.882
-1.418
-1.72%
1 gen 1977 anni
80.902
+0.02
0.02%
1 gen 1978 anni
81.139
+0.237
0.29%
1 gen 1979 anni
82.878
+1.739
2.14%
1 gen 1980 anni
85.651
+2.773
3.35%
1 gen 1981 anni
85.139
-0.512
-0.6%
1 gen 1982 anni
85.562
+0.423
0.5%
1 gen 1983 anni
84.346
-1.216
-1.42%
1 gen 1984 anni
83.773
-0.573
-0.68%
1 gen 1985 anni
85.002
+1.229
1.47%
1 gen 1986 anni
82.501
-2.501
-2.94%
1 gen 1987 anni
85.506
+3.005
3.64%
1 gen 1988 anni
84.682
-0.824
-0.96%
1 gen 1989 anni
83.894
-0.787
-0.93%
1 gen 1990 anni
84.98
+1.085
1.29%
1 gen 1991 anni
85.062
+0.082
0.1%
1 gen 1992 anni
85.433
+0.371
0.44%
1 gen 1993 anni
84.56
-0.873
-1.02%
1 gen 1994 anni
86.156
+1.596
1.89%
1 gen 1995 anni
86.854
+0.698
0.81%
1 gen 1996 anni
88.056
+1.202
1.38%
1 gen 1997 anni
89.449
+1.393
1.58%
1 gen 1998 anni
89.303
-0.146
-0.16%
1 gen 1999 anni
90.064
+0.761
0.85%
1 gen 2000 anni
91.799
+1.735
1.93%
1 gen 2001 anni
92.516
+0.717
0.78%
1 gen 2002 anni
92.522
+0.006
0.01%
1 gen 2003 anni
91.459
-1.062
-1.15%
1 gen 2004 anni
92.002
+0.543
0.59%
1 gen 2005 anni
93.277
+1.275
1.39%
1 gen 2006 anni
90.916
-2.361
-2.53%
1 gen 2007 anni
90.973
+0.057
0.06%
1 gen 2008 anni
90.994
+0.021
0.02%
1 gen 2009 anni
89.924
-1.069
-1.18%
1 gen 2010 anni
88.826
-1.098
-1.22%
1 gen 2011 anni
89.671
+0.844
0.95%
1 gen 2012 anni
87.902
-1.769
-1.97%
1 gen 2013 anni
86.484
-1.419
-1.61%
1 gen 2014 anni
86.285
-0.198
-0.23%
1 gen 2015 anni
85.171
-1.115
-1.29%
Classificazione dei paesi secondo i statistiche attuali per anni


Commenti: