29
/it/
it
AIzaSyAYiBZKx7MnpbEhh9jyipgxe19OcubqV5w
April 1, 2024
150361
Honduras
HND
true
2
1
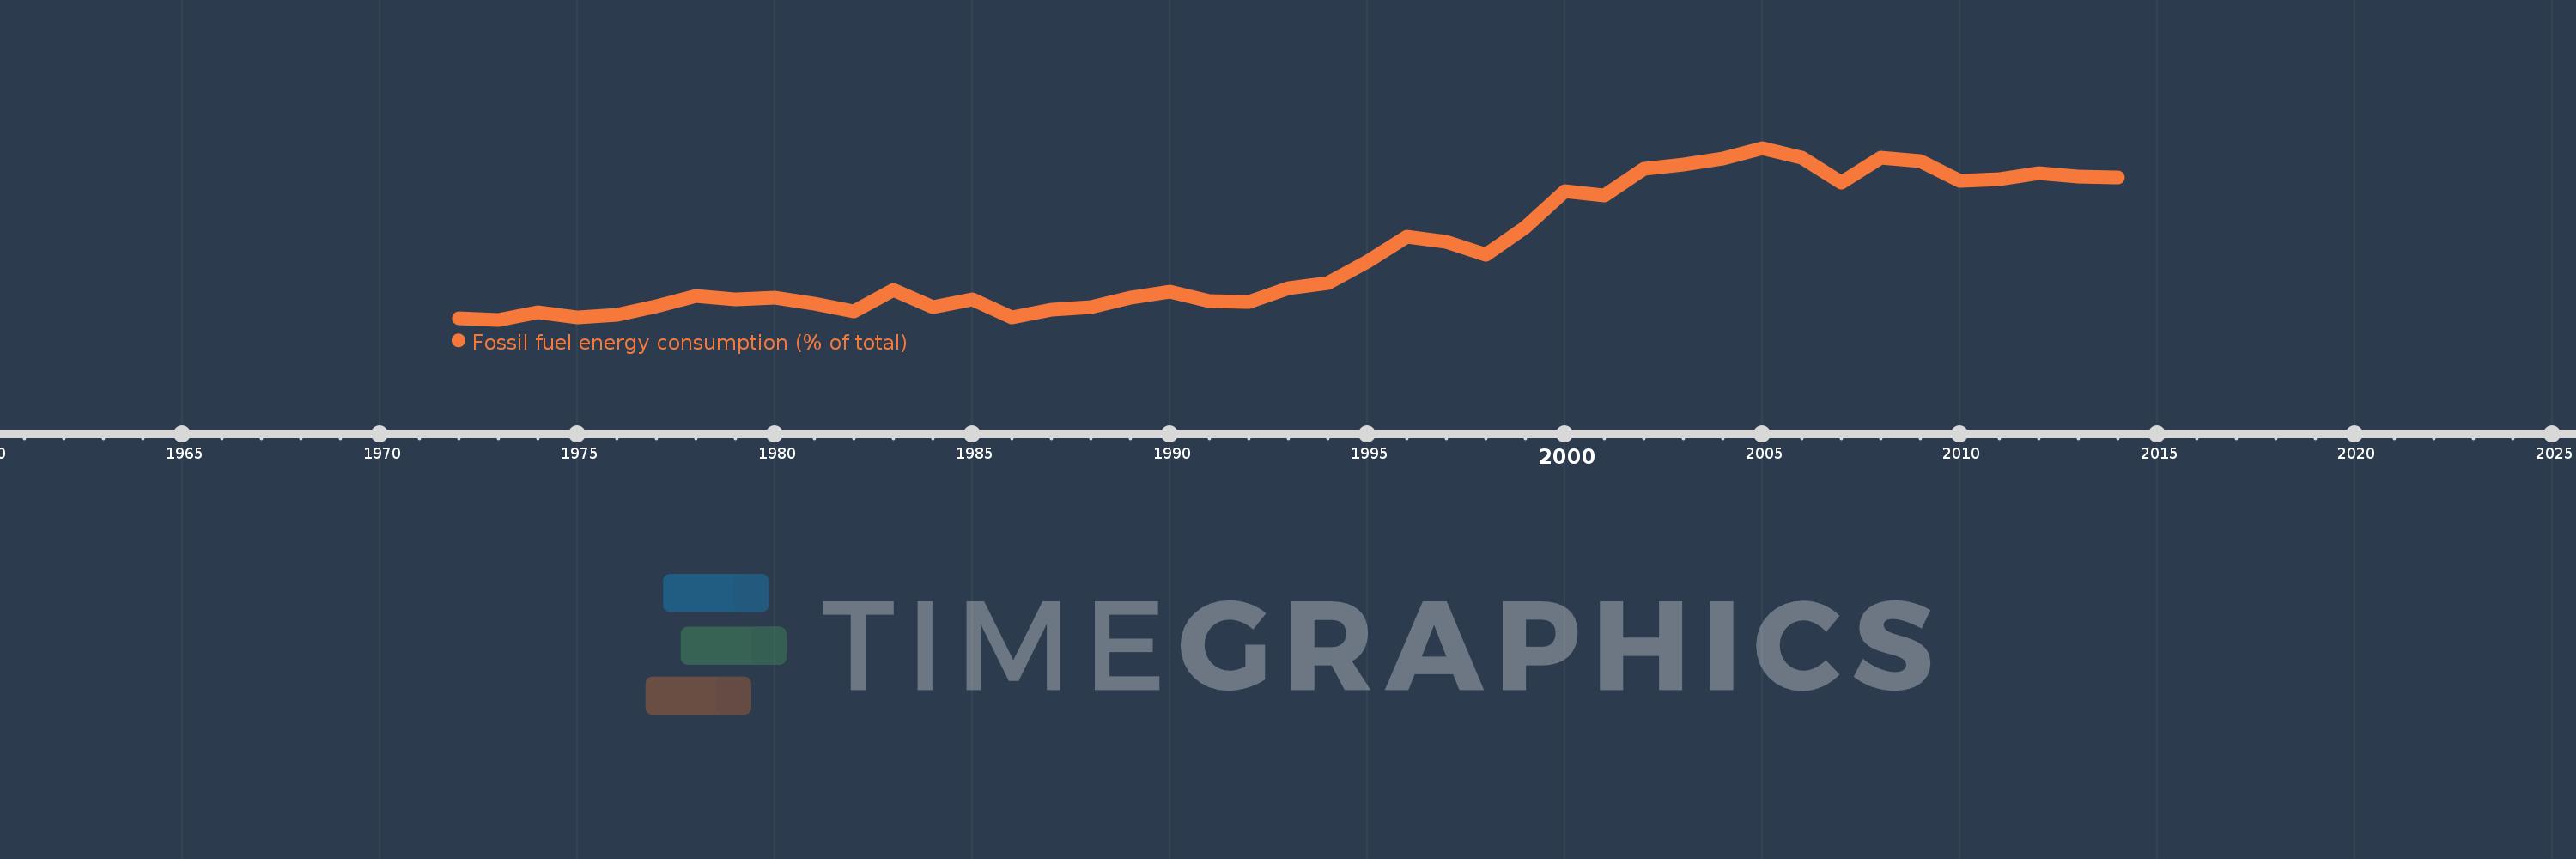
Fossil fuel energy consumption (% of total)
2014,2013,2012,2011,2010,2009,2008,2007,2006,2005,2004,2003,2002,2001,2000,1999,1998,1997,1996,1995,1994,1993,1992,1991,1990,1989,1988,1987,1986,1985,1984,1983,1982,1981,1980,1979,1978,1977,1976,1975,1974,1973,1972
Queste statistiche in altri paesi:
AlbaniaAlgeriaAngolaAntigua and BarbudaArab WorldArgentinaArmeniaAustraliaAustriaAzerbaijanBahamas, TheBahrainBangladeshBarbadosBelarusBelgiumBelizeBeninBhutanBoliviaBosnia and HerzegovinaBotswanaBrazilBrunei DarussalamBulgariaCabo VerdeCambodiaCameroonCanadaCaribbean small statesCentral Europe and the BalticsChileChinaColombiaComorosCongo, Dem. Rep.Congo, Rep.Costa RicaCote d'IvoireCroatiaCubaCuracaoCyprusCzech RepublicDenmarkDjiboutiDominicaDominican RepublicEarly-demographic dividendEast Asia & PacificEast Asia & Pacific (excluding high income)East Asia & Pacific (IDA & IBRD countries)EcuadorEgypt, Arab Rep.El SalvadorEquatorial GuineaEritreaEstoniaEthiopiaEuro areaEurope & Central AsiaEurope & Central Asia (excluding high income)Europe & Central Asia (IDA & IBRD countries)European UnionFijiFinlandFragile and conflict affected situationsFranceGabonGambia, TheGeorgiaGermanyGhanaGibraltarGreeceGrenadaGuatemalaGuinea-BissauGuyanaHaitiHeavily indebted poor countries (HIPC)High incomeHondurasHong Kong SAR, ChinaHungaryIBRD onlyIcelandIDA & IBRD totalIDA blendIDA onlyIDA totalIndiaIndonesiaIran, Islamic Rep.IraqIrelandIsraelItalyJamaicaJapanJordanKazakhstanKenyaKiribatiKorea, Dem. People’s Rep.Korea, Rep.KosovoKuwaitKyrgyz RepublicLate-demographic dividendLatin America & Caribbean Latin America & Caribbean (excluding high income)Latin America & the Caribbean (IDA & IBRD countries)LatviaLeast developed countries: UN classificationLebanonLesothoLibyaLithuaniaLow & middle incomeLow incomeLower middle incomeLuxembourgMacedonia, FYRMalaysiaMaldivesMaltaMarshall IslandsMauritiusMexicoMiddle East & North AfricaMiddle East & North Africa (excluding high income)Middle East & North Africa (IDA & IBRD countries)Middle incomeMoldovaMongoliaMontenegroMoroccoMozambiqueMyanmarNamibiaNepalNetherlandsNew ZealandNicaraguaNigerNigeriaNorth AmericaNorwayOECD membersOmanOther small statesPacific island small statesPakistanPalauPanamaParaguayPeruPhilippinesPolandPortugalPost-demographic dividendPre-demographic dividendQatarRomaniaRussian FederationSamoaSao Tome and PrincipeSaudi ArabiaSenegalSerbiaSeychellesSingaporeSlovak RepublicSloveniaSmall statesSolomon IslandsSouth AfricaSouth AsiaSouth Asia (IDA & IBRD)South SudanSpainSri LankaSt. Kitts and NevisSt. LuciaSt. Vincent and the GrenadinesSub-Saharan Africa Sub-Saharan Africa (excluding high income)Sub-Saharan Africa (IDA & IBRD countries)SudanSurinameSwazilandSwedenSwitzerlandSyrian Arab RepublicTajikistanTanzaniaThailandTimor-LesteTogoTongaTrinidad and TobagoTunisiaTurkeyUkraineUnited Arab EmiratesUnited KingdomUnited StatesUpper middle incomeUruguayUzbekistanVanuatuVenezuela, RBVietnamWorldYemen, Rep.ZambiaZimbabwe Linea del tempo:
Questa scala temporale mostra un grafico dal 1972 anno al 2014 anno. Honduras. I dati fino ad 1971 anno non disponibili. Il numero di osservazioni attuali secondo i date: 43.
La fonte (nome):
Indicatori dello sviluppo mondiale
La fonte (organizzazione):
IEA Statistics © OECD/IEA 2014 (http://www.iea.org/stats/index.asp), subject to https://www.iea.org/t&c/termsandconditions/
Categorie:
Energy & Mining
sono stati aggiornati
23 apr 2017 anni
Indicatori delle variazioni dei valori per anni
Minima:
26.878
1 gen 1973 anni
Massimo:
56.481
1 gen 2005 anni
Alla data di osservazione
Valore
Variazione assoluta
La variazione rispetto al valore precedente
1 gen 1972 anni
27.135
+27.135
0.0%
1 gen 1973 anni
26.878
-0.258
-0.95%
1 gen 1974 anni
28.215
+1.337
4.98%
1 gen 1975 anni
27.253
-0.963
-3.41%
1 gen 1976 anni
27.784
+0.531
1.95%
1 gen 1977 anni
29.129
+1.345
4.84%
1 gen 1978 anni
31.011
+1.882
6.46%
1 gen 1979 anni
30.384
-0.627
-2.02%
1 gen 1980 anni
30.619
+0.234
0.77%
1 gen 1981 anni
29.7
-0.919
-3.0%
1 gen 1982 anni
28.342
-1.357
-4.57%
1 gen 1983 anni
32.011
+3.668
12.94%
1 gen 1984 anni
28.989
-3.021
-9.44%
1 gen 1985 anni
30.428
+1.439
4.96%
1 gen 1986 anni
27.225
-3.203
-10.53%
1 gen 1987 anni
28.651
+1.426
5.24%
1 gen 1988 anni
29.121
+0.47
1.64%
1 gen 1989 anni
30.648
+1.527
5.24%
1 gen 1990 anni
31.775
+1.126
3.68%
1 gen 1991 anni
30.016
-1.758
-5.53%
1 gen 1992 anni
29.87
-0.147
-0.49%
1 gen 1993 anni
32.283
+2.413
8.08%
1 gen 1994 anni
33.224
+0.942
2.92%
1 gen 1995 anni
36.952
+3.727
11.22%
1 gen 1996 anni
41.236
+4.285
11.6%
1 gen 1997 anni
40.323
-0.913
-2.21%
1 gen 1998 anni
38.11
-2.213
-5.49%
1 gen 1999 anni
42.869
+4.759
12.49%
1 gen 2000 anni
49.09
+6.221
14.51%
1 gen 2001 anni
48.272
-0.817
-1.67%
1 gen 2002 anni
52.813
+4.54
9.41%
1 gen 2003 anni
53.553
+0.74
1.4%
1 gen 2004 anni
54.734
+1.181
2.2%
1 gen 2005 anni
56.481
+1.748
3.19%
1 gen 2006 anni
54.862
-1.619
-2.87%
1 gen 2007 anni
50.477
-4.385
-7.99%
1 gen 2008 anni
54.826
+4.349
8.62%
1 gen 2009 anni
54.278
-0.548
-1.0%
1 gen 2010 anni
50.8
-3.477
-6.41%
1 gen 2011 anni
51.167
+0.366
0.72%
1 gen 2012 anni
52.149
+0.982
1.92%
1 gen 2013 anni
51.485
-0.664
-1.27%
1 gen 2014 anni
51.351
-0.134
-0.26%
Classificazione dei paesi secondo i statistiche attuali per anni


Commenti: