29
/it/
it
AIzaSyAYiBZKx7MnpbEhh9jyipgxe19OcubqV5w
April 1, 2024
247534
Spain
ESP
true
2
1
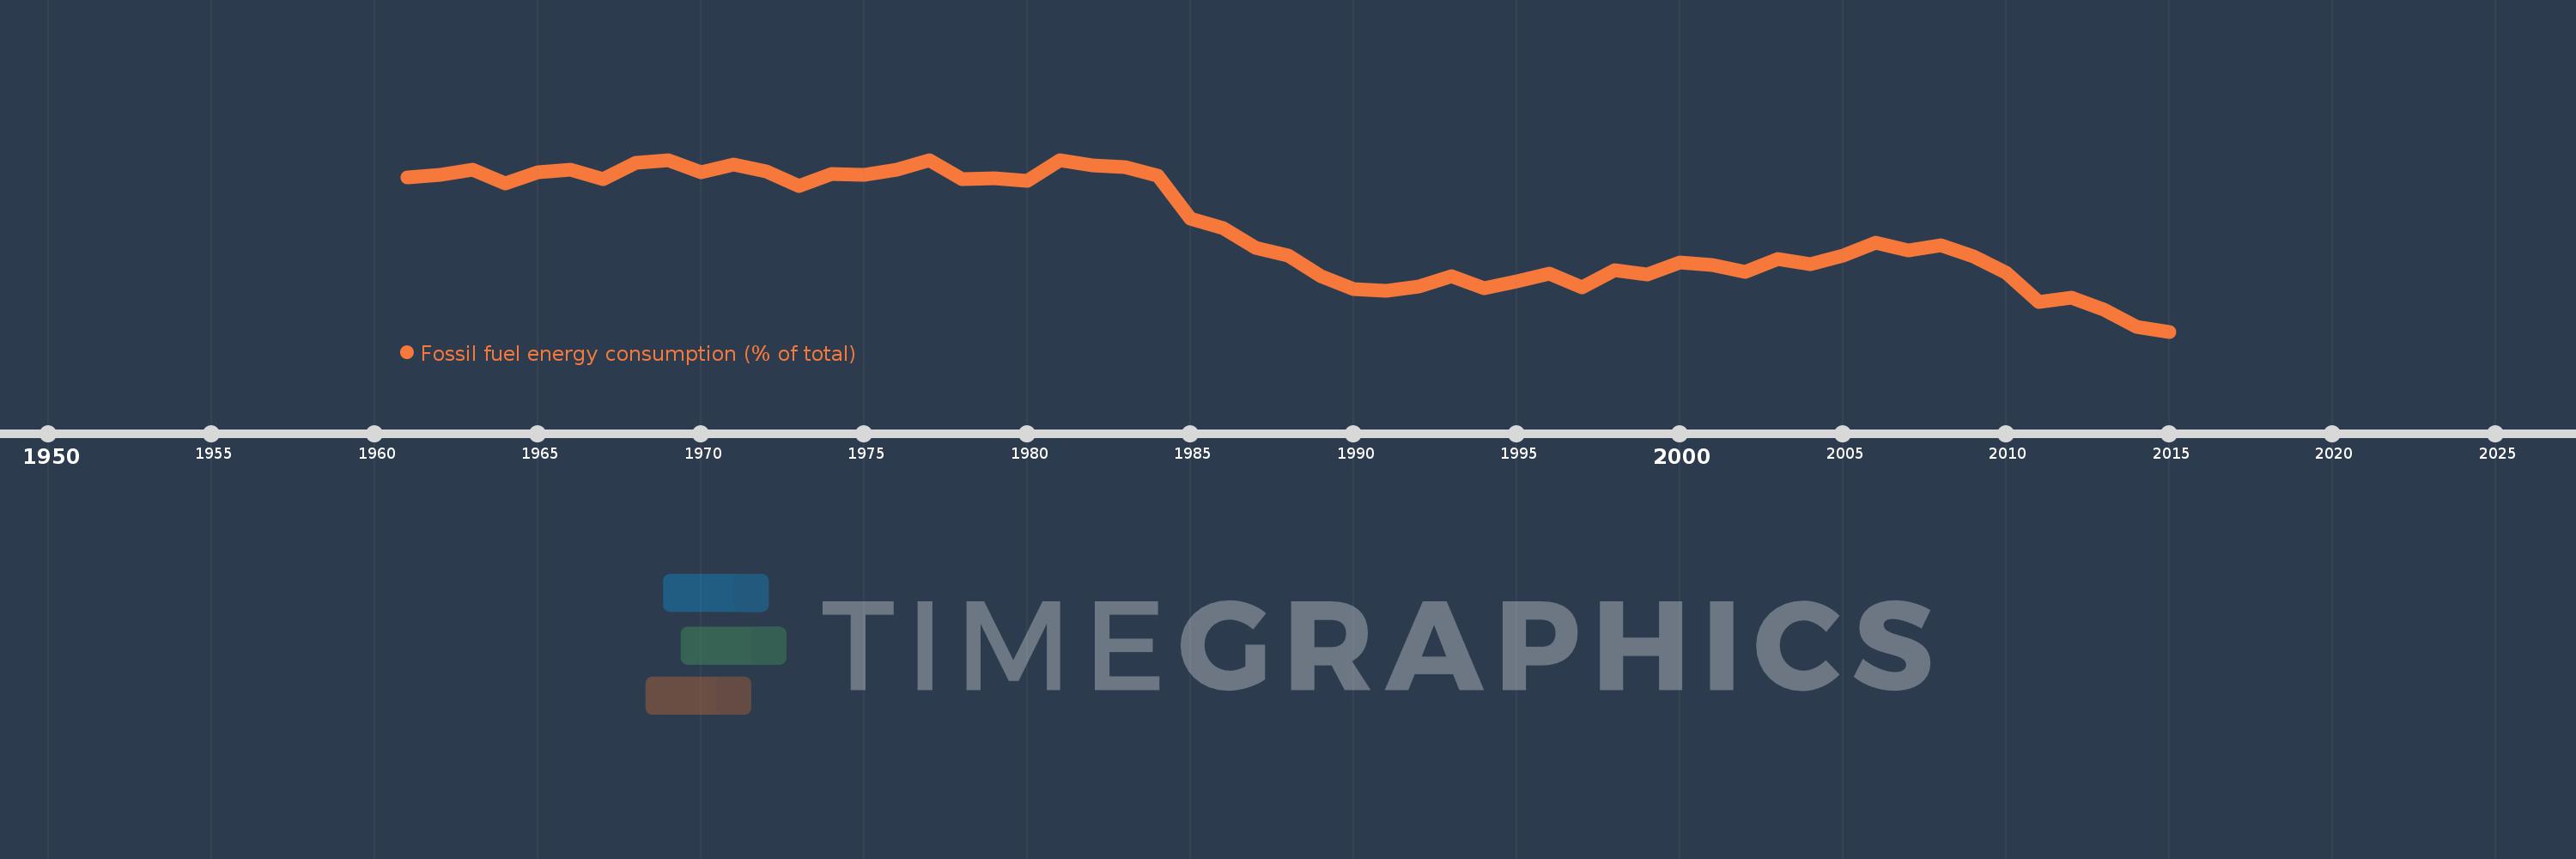
Fossil fuel energy consumption (% of total)
2015,2014,2013,2012,2011,2010,2009,2008,2007,2006,2005,2004,2003,2002,2001,2000,1999,1998,1997,1996,1995,1994,1993,1992,1991,1990,1989,1988,1987,1986,1985,1984,1983,1982,1981,1980,1979,1978,1977,1976,1975,1974,1973,1972,1971,1970,1969,1968,1967,1966,1965,1964,1963,1962,1961
Queste statistiche in altri paesi:
AlbaniaAlgeriaAngolaAntigua and BarbudaArab WorldArgentinaArmeniaAustraliaAustriaAzerbaijanBahamas, TheBahrainBangladeshBarbadosBelarusBelgiumBelizeBeninBhutanBoliviaBosnia and HerzegovinaBotswanaBrazilBrunei DarussalamBulgariaCabo VerdeCambodiaCameroonCanadaCaribbean small statesCentral Europe and the BalticsChileChinaColombiaComorosCongo, Dem. Rep.Congo, Rep.Costa RicaCote d'IvoireCroatiaCubaCuracaoCyprusCzech RepublicDenmarkDjiboutiDominicaDominican RepublicEarly-demographic dividendEast Asia & PacificEast Asia & Pacific (excluding high income)East Asia & Pacific (IDA & IBRD countries)EcuadorEgypt, Arab Rep.El SalvadorEquatorial GuineaEritreaEstoniaEthiopiaEuro areaEurope & Central AsiaEurope & Central Asia (excluding high income)Europe & Central Asia (IDA & IBRD countries)European UnionFijiFinlandFragile and conflict affected situationsFranceGabonGambia, TheGeorgiaGermanyGhanaGibraltarGreeceGrenadaGuatemalaGuinea-BissauGuyanaHaitiHeavily indebted poor countries (HIPC)High incomeHondurasHong Kong SAR, ChinaHungaryIBRD onlyIcelandIDA & IBRD totalIDA blendIDA onlyIDA totalIndiaIndonesiaIran, Islamic Rep.IraqIrelandIsraelItalyJamaicaJapanJordanKazakhstanKenyaKiribatiKorea, Dem. People’s Rep.Korea, Rep.KosovoKuwaitKyrgyz RepublicLate-demographic dividendLatin America & Caribbean Latin America & Caribbean (excluding high income)Latin America & the Caribbean (IDA & IBRD countries)LatviaLeast developed countries: UN classificationLebanonLesothoLibyaLithuaniaLow & middle incomeLow incomeLower middle incomeLuxembourgMacedonia, FYRMalaysiaMaldivesMaltaMarshall IslandsMauritiusMexicoMiddle East & North AfricaMiddle East & North Africa (excluding high income)Middle East & North Africa (IDA & IBRD countries)Middle incomeMoldovaMongoliaMontenegroMoroccoMozambiqueMyanmarNamibiaNepalNetherlandsNew ZealandNicaraguaNigerNigeriaNorth AmericaNorwayOECD membersOmanOther small statesPacific island small statesPakistanPalauPanamaParaguayPeruPhilippinesPolandPortugalPost-demographic dividendPre-demographic dividendQatarRomaniaRussian FederationSamoaSao Tome and PrincipeSaudi ArabiaSenegalSerbiaSeychellesSingaporeSlovak RepublicSloveniaSmall statesSolomon IslandsSouth AfricaSouth AsiaSouth Asia (IDA & IBRD)South SudanSpainSri LankaSt. Kitts and NevisSt. LuciaSt. Vincent and the GrenadinesSub-Saharan Africa Sub-Saharan Africa (excluding high income)Sub-Saharan Africa (IDA & IBRD countries)SudanSurinameSwazilandSwedenSwitzerlandSyrian Arab RepublicTajikistanTanzaniaThailandTimor-LesteTogoTongaTrinidad and TobagoTunisiaTurkeyUkraineUnited Arab EmiratesUnited KingdomUnited StatesUpper middle incomeUruguayUzbekistanVanuatuVenezuela, RBVietnamWorldYemen, Rep.ZambiaZimbabwe Linea del tempo:
Questa scala temporale mostra un grafico dal 1961 anno al 2015 anno. Spain. I dati fino ad 1960 anno non disponibili. Il numero di osservazioni attuali secondo i date: 55.
La fonte (nome):
Indicatori dello sviluppo mondiale
La fonte (organizzazione):
IEA Statistics © OECD/IEA 2014 (http://www.iea.org/stats/index.asp), subject to https://www.iea.org/t&c/termsandconditions/
Categorie:
Energy & Mining
sono stati aggiornati
23 apr 2017 anni
Indicatori delle variazioni dei valori per anni
Minima:
72.239
1 gen 2015 anni
Massimo:
94.032
1 gen 1981 anni
Alla data di osservazione
Valore
Variazione assoluta
La variazione rispetto al valore precedente
1 gen 1961 anni
91.765
+91.765
0.0%
1 gen 1962 anni
92.105
+0.339
0.37%
1 gen 1963 anni
92.754
+0.649
0.71%
1 gen 1964 anni
91.047
-1.707
-1.84%
1 gen 1965 anni
92.404
+1.357
1.49%
1 gen 1966 anni
92.825
+0.422
0.46%
1 gen 1967 anni
91.595
-1.231
-1.33%
1 gen 1968 anni
93.649
+2.054
2.24%
1 gen 1969 anni
94.018
+0.369
0.39%
1 gen 1970 anni
92.459
-1.559
-1.66%
1 gen 1971 anni
93.392
+0.933
1.01%
1 gen 1972 anni
92.51
-0.882
-0.94%
1 gen 1973 anni
90.756
-1.754
-1.9%
1 gen 1974 anni
92.182
+1.427
1.57%
1 gen 1975 anni
92.082
-0.1
-0.11%
1 gen 1976 anni
92.727
+0.645
0.7%
1 gen 1977 anni
93.931
+1.204
1.3%
1 gen 1978 anni
91.593
-2.339
-2.49%
1 gen 1979 anni
91.67
+0.078
0.08%
1 gen 1980 anni
91.4
-0.27
-0.29%
1 gen 1981 anni
94.032
+2.631
2.88%
1 gen 1982 anni
93.35
-0.682
-0.73%
1 gen 1983 anni
93.071
-0.279
-0.3%
1 gen 1984 anni
92.001
-1.069
-1.15%
1 gen 1985 anni
86.583
-5.418
-5.89%
1 gen 1986 anni
85.402
-1.181
-1.36%
1 gen 1987 anni
82.892
-2.51
-2.94%
1 gen 1988 anni
81.852
-1.041
-1.26%
1 gen 1989 anni
79.304
-2.548
-3.11%
1 gen 1990 anni
77.604
-1.7
-2.14%
1 gen 1991 anni
77.386
-0.218
-0.28%
1 gen 1992 anni
77.952
+0.566
0.73%
1 gen 1993 anni
79.254
+1.302
1.67%
1 gen 1994 anni
77.692
-1.562
-1.97%
1 gen 1995 anni
78.59
+0.898
1.16%
1 gen 1996 anni
79.601
+1.011
1.29%
1 gen 1997 anni
77.854
-1.747
-2.2%
1 gen 1998 anni
80.061
+2.208
2.84%
1 gen 1999 anni
79.526
-0.535
-0.67%
1 gen 2000 anni
80.976
+1.45
1.82%
1 gen 2001 anni
80.635
-0.341
-0.42%
1 gen 2002 anni
79.85
-0.785
-0.97%
1 gen 2003 anni
81.461
+1.611
2.02%
1 gen 2004 anni
80.823
-0.638
-0.78%
1 gen 2005 anni
81.832
+1.009
1.25%
1 gen 2006 anni
83.467
+1.635
2.0%
1 gen 2007 anni
82.51
-0.957
-1.15%
1 gen 2008 anni
83.186
+0.677
0.82%
1 gen 2009 anni
81.808
-1.378
-1.66%
1 gen 2010 anni
79.71
-2.098
-2.56%
1 gen 2011 anni
76.001
-3.709
-4.65%
1 gen 2012 anni
76.5
+0.499
0.66%
1 gen 2013 anni
75.008
-1.492
-1.95%
1 gen 2014 anni
72.792
-2.216
-2.95%
1 gen 2015 anni
72.239
-0.553
-0.76%
Classificazione dei paesi secondo i statistiche attuali per anni


Commenti: