29
/it/
it
AIzaSyAYiBZKx7MnpbEhh9jyipgxe19OcubqV5w
April 1, 2024
38148
IDA blend
IDB
false
2
1
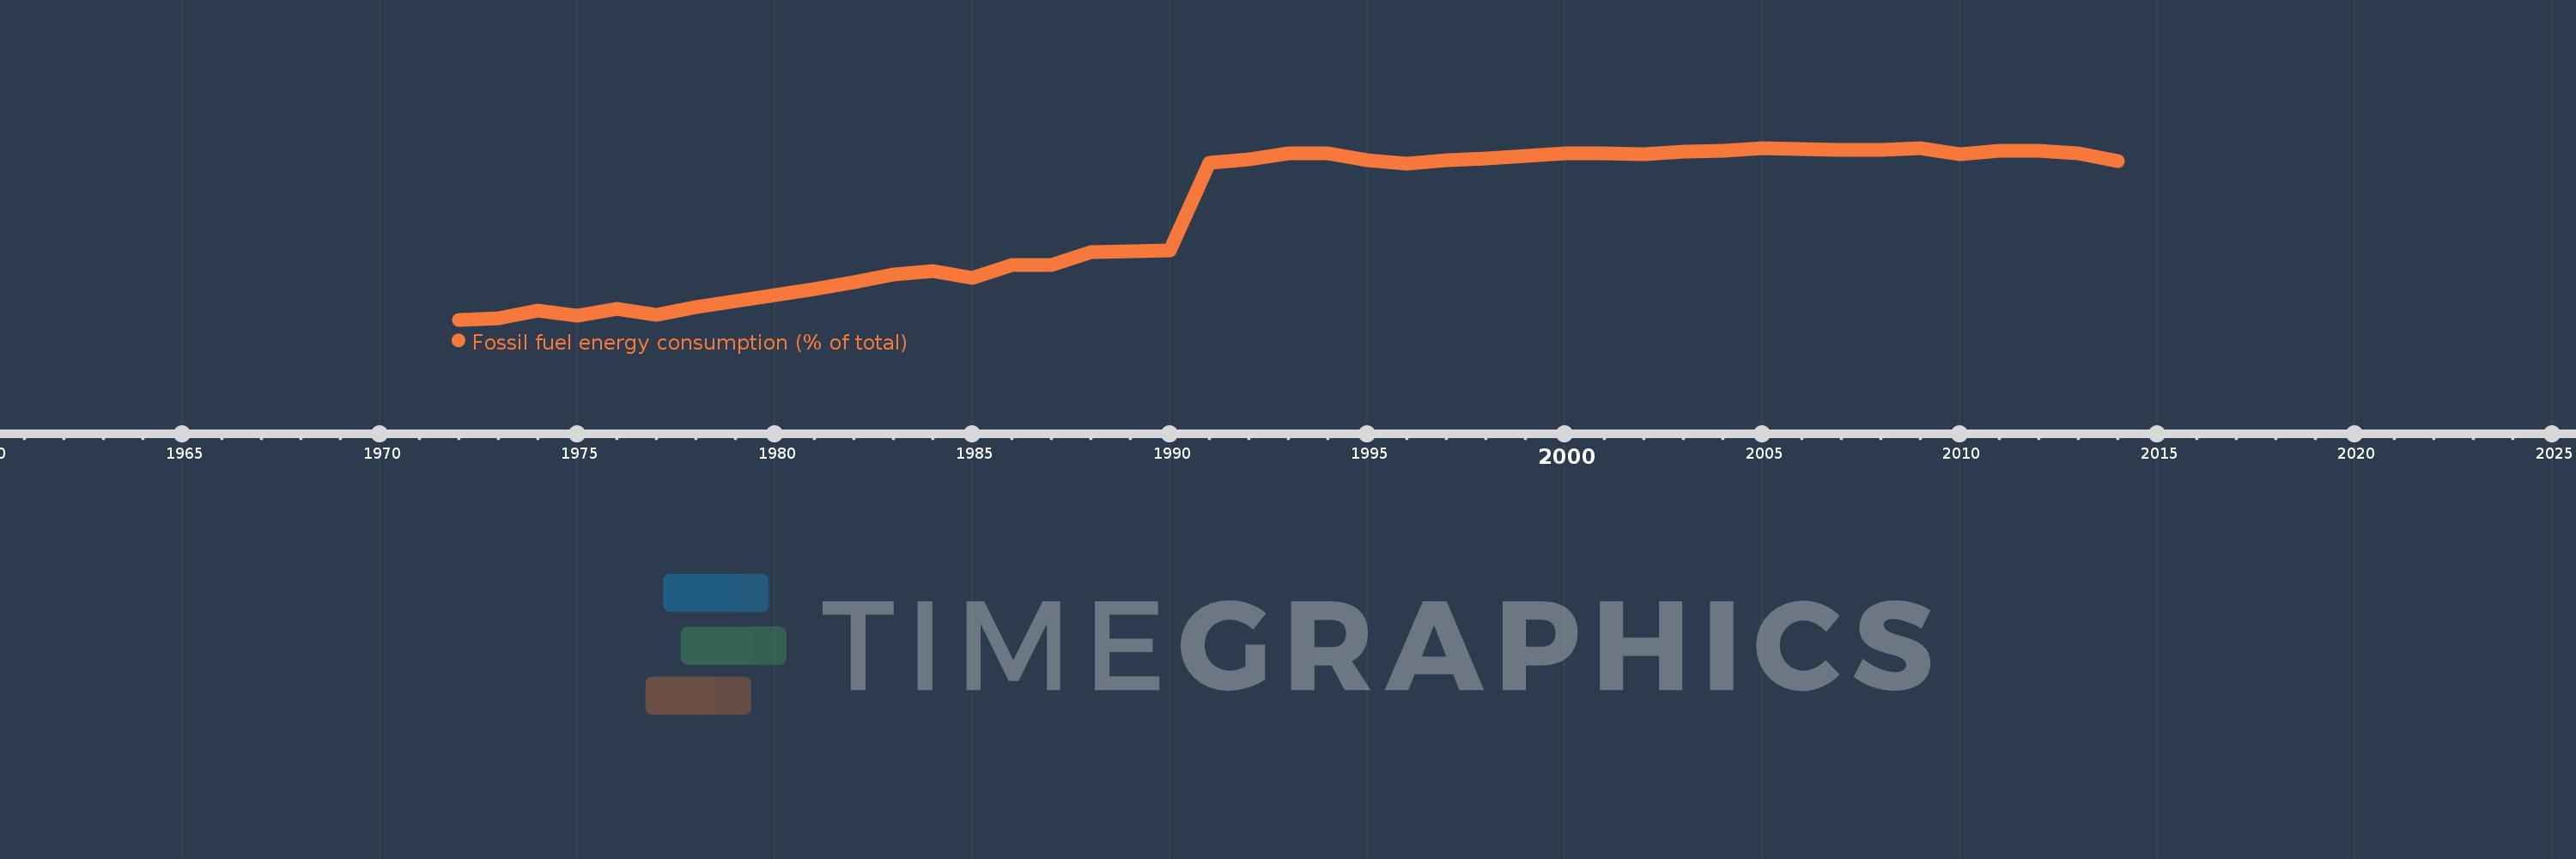
Fossil fuel energy consumption (% of total)
2014,2013,2012,2011,2010,2009,2008,2007,2006,2005,2004,2003,2002,2001,2000,1999,1998,1997,1996,1995,1994,1993,1992,1991,1990,1989,1988,1987,1986,1985,1984,1983,1982,1981,1980,1979,1978,1977,1976,1975,1974,1973,1972
Queste statistiche in altri paesi:
AlbaniaAlgeriaAngolaAntigua and BarbudaArab WorldArgentinaArmeniaAustraliaAustriaAzerbaijanBahamas, TheBahrainBangladeshBarbadosBelarusBelgiumBelizeBeninBhutanBoliviaBosnia and HerzegovinaBotswanaBrazilBrunei DarussalamBulgariaCabo VerdeCambodiaCameroonCanadaCaribbean small statesCentral Europe and the BalticsChileChinaColombiaComorosCongo, Dem. Rep.Congo, Rep.Costa RicaCote d'IvoireCroatiaCubaCuracaoCyprusCzech RepublicDenmarkDjiboutiDominicaDominican RepublicEarly-demographic dividendEast Asia & PacificEast Asia & Pacific (excluding high income)East Asia & Pacific (IDA & IBRD countries)EcuadorEgypt, Arab Rep.El SalvadorEquatorial GuineaEritreaEstoniaEthiopiaEuro areaEurope & Central AsiaEurope & Central Asia (excluding high income)Europe & Central Asia (IDA & IBRD countries)European UnionFijiFinlandFragile and conflict affected situationsFranceGabonGambia, TheGeorgiaGermanyGhanaGibraltarGreeceGrenadaGuatemalaGuinea-BissauGuyanaHaitiHeavily indebted poor countries (HIPC)High incomeHondurasHong Kong SAR, ChinaHungaryIBRD onlyIcelandIDA & IBRD totalIDA blendIDA onlyIDA totalIndiaIndonesiaIran, Islamic Rep.IraqIrelandIsraelItalyJamaicaJapanJordanKazakhstanKenyaKiribatiKorea, Dem. People’s Rep.Korea, Rep.KosovoKuwaitKyrgyz RepublicLate-demographic dividendLatin America & Caribbean Latin America & Caribbean (excluding high income)Latin America & the Caribbean (IDA & IBRD countries)LatviaLeast developed countries: UN classificationLebanonLesothoLibyaLithuaniaLow & middle incomeLow incomeLower middle incomeLuxembourgMacedonia, FYRMalaysiaMaldivesMaltaMarshall IslandsMauritiusMexicoMiddle East & North AfricaMiddle East & North Africa (excluding high income)Middle East & North Africa (IDA & IBRD countries)Middle incomeMoldovaMongoliaMontenegroMoroccoMozambiqueMyanmarNamibiaNepalNetherlandsNew ZealandNicaraguaNigerNigeriaNorth AmericaNorwayOECD membersOmanOther small statesPacific island small statesPakistanPalauPanamaParaguayPeruPhilippinesPolandPortugalPost-demographic dividendPre-demographic dividendQatarRomaniaRussian FederationSamoaSao Tome and PrincipeSaudi ArabiaSenegalSerbiaSeychellesSingaporeSlovak RepublicSloveniaSmall statesSolomon IslandsSouth AfricaSouth AsiaSouth Asia (IDA & IBRD)South SudanSpainSri LankaSt. Kitts and NevisSt. LuciaSt. Vincent and the GrenadinesSub-Saharan Africa Sub-Saharan Africa (excluding high income)Sub-Saharan Africa (IDA & IBRD countries)SudanSurinameSwazilandSwedenSwitzerlandSyrian Arab RepublicTajikistanTanzaniaThailandTimor-LesteTogoTongaTrinidad and TobagoTunisiaTurkeyUkraineUnited Arab EmiratesUnited KingdomUnited StatesUpper middle incomeUruguayUzbekistanVanuatuVenezuela, RBVietnamWorldYemen, Rep.ZambiaZimbabwe Linea del tempo:
Questa scala temporale mostra un grafico dal 1972 anno al 2014 anno. IDA blend. I dati fino ad 1971 anno non disponibili. Il numero di osservazioni attuali secondo i date: 43.
La fonte (nome):
Indicatori dello sviluppo mondiale
La fonte (organizzazione):
IEA Statistics © OECD/IEA 2014 (http://www.iea.org/stats/index.asp), subject to https://www.iea.org/t&c/termsandconditions/
Categorie:
Energy & Mining
sono stati aggiornati
23 apr 2017 anni
Indicatori delle variazioni dei valori per anni
Minima:
22.487
1 gen 1972 anni
Massimo:
51.844
1 gen 2005 anni
Alla data di osservazione
Valore
Variazione assoluta
La variazione rispetto al valore precedente
1 gen 1972 anni
22.487
+22.487
0.0%
1 gen 1973 anni
22.73
+0.243
1.08%
1 gen 1974 anni
24.108
+1.378
6.06%
1 gen 1975 anni
23.241
-0.866
-3.59%
1 gen 1976 anni
24.294
+1.052
4.53%
1 gen 1977 anni
23.352
-0.941
-3.87%
1 gen 1978 anni
24.682
+1.329
5.69%
1 gen 1979 anni
25.617
+0.935
3.79%
1 gen 1980 anni
26.638
+1.021
3.99%
1 gen 1981 anni
27.749
+1.111
4.17%
1 gen 1982 anni
28.925
+1.176
4.24%
1 gen 1983 anni
30.283
+1.358
4.69%
1 gen 1984 anni
30.742
+0.459
1.51%
1 gen 1985 anni
29.57
-1.172
-3.81%
1 gen 1986 anni
31.794
+2.224
7.52%
1 gen 1987 anni
31.765
-0.029
-0.09%
1 gen 1988 anni
33.988
+2.223
7.0%
1 gen 1989 anni
34.15
+0.162
0.48%
1 gen 1990 anni
34.302
+0.152
0.44%
1 gen 1991 anni
49.368
+15.066
43.92%
1 gen 1992 anni
49.838
+0.47
0.95%
1 gen 1993 anni
50.896
+1.058
2.12%
1 gen 1994 anni
50.989
+0.093
0.18%
1 gen 1995 anni
49.799
-1.19
-2.33%
1 gen 1996 anni
49.122
-0.678
-1.36%
1 gen 1997 anni
49.803
+0.681
1.39%
1 gen 1998 anni
49.991
+0.188
0.38%
1 gen 1999 anni
50.516
+0.525
1.05%
1 gen 2000 anni
50.912
+0.396
0.78%
1 gen 2001 anni
50.864
-0.048
-0.09%
1 gen 2002 anni
50.787
-0.077
-0.15%
1 gen 2003 anni
51.262
+0.475
0.94%
1 gen 2004 anni
51.29
+0.028
0.05%
1 gen 2005 anni
51.844
+0.554
1.08%
1 gen 2006 anni
51.628
-0.216
-0.42%
1 gen 2007 anni
51.517
-0.11
-0.21%
1 gen 2008 anni
51.514
-0.003
-0.01%
1 gen 2009 anni
51.771
+0.257
0.5%
1 gen 2010 anni
50.843
-0.928
-1.79%
1 gen 2011 anni
51.391
+0.548
1.08%
1 gen 2012 anni
51.392
+0.001
0.0%
1 gen 2013 anni
50.884
-0.508
-0.99%
1 gen 2014 anni
49.613
-1.272
-2.5%
Classificazione dei paesi secondo i statistiche attuali per anni


Commenti: