29
/it/
it
AIzaSyAYiBZKx7MnpbEhh9jyipgxe19OcubqV5w
April 1, 2024
53971
Pacific island small states
PSS
false
2
1
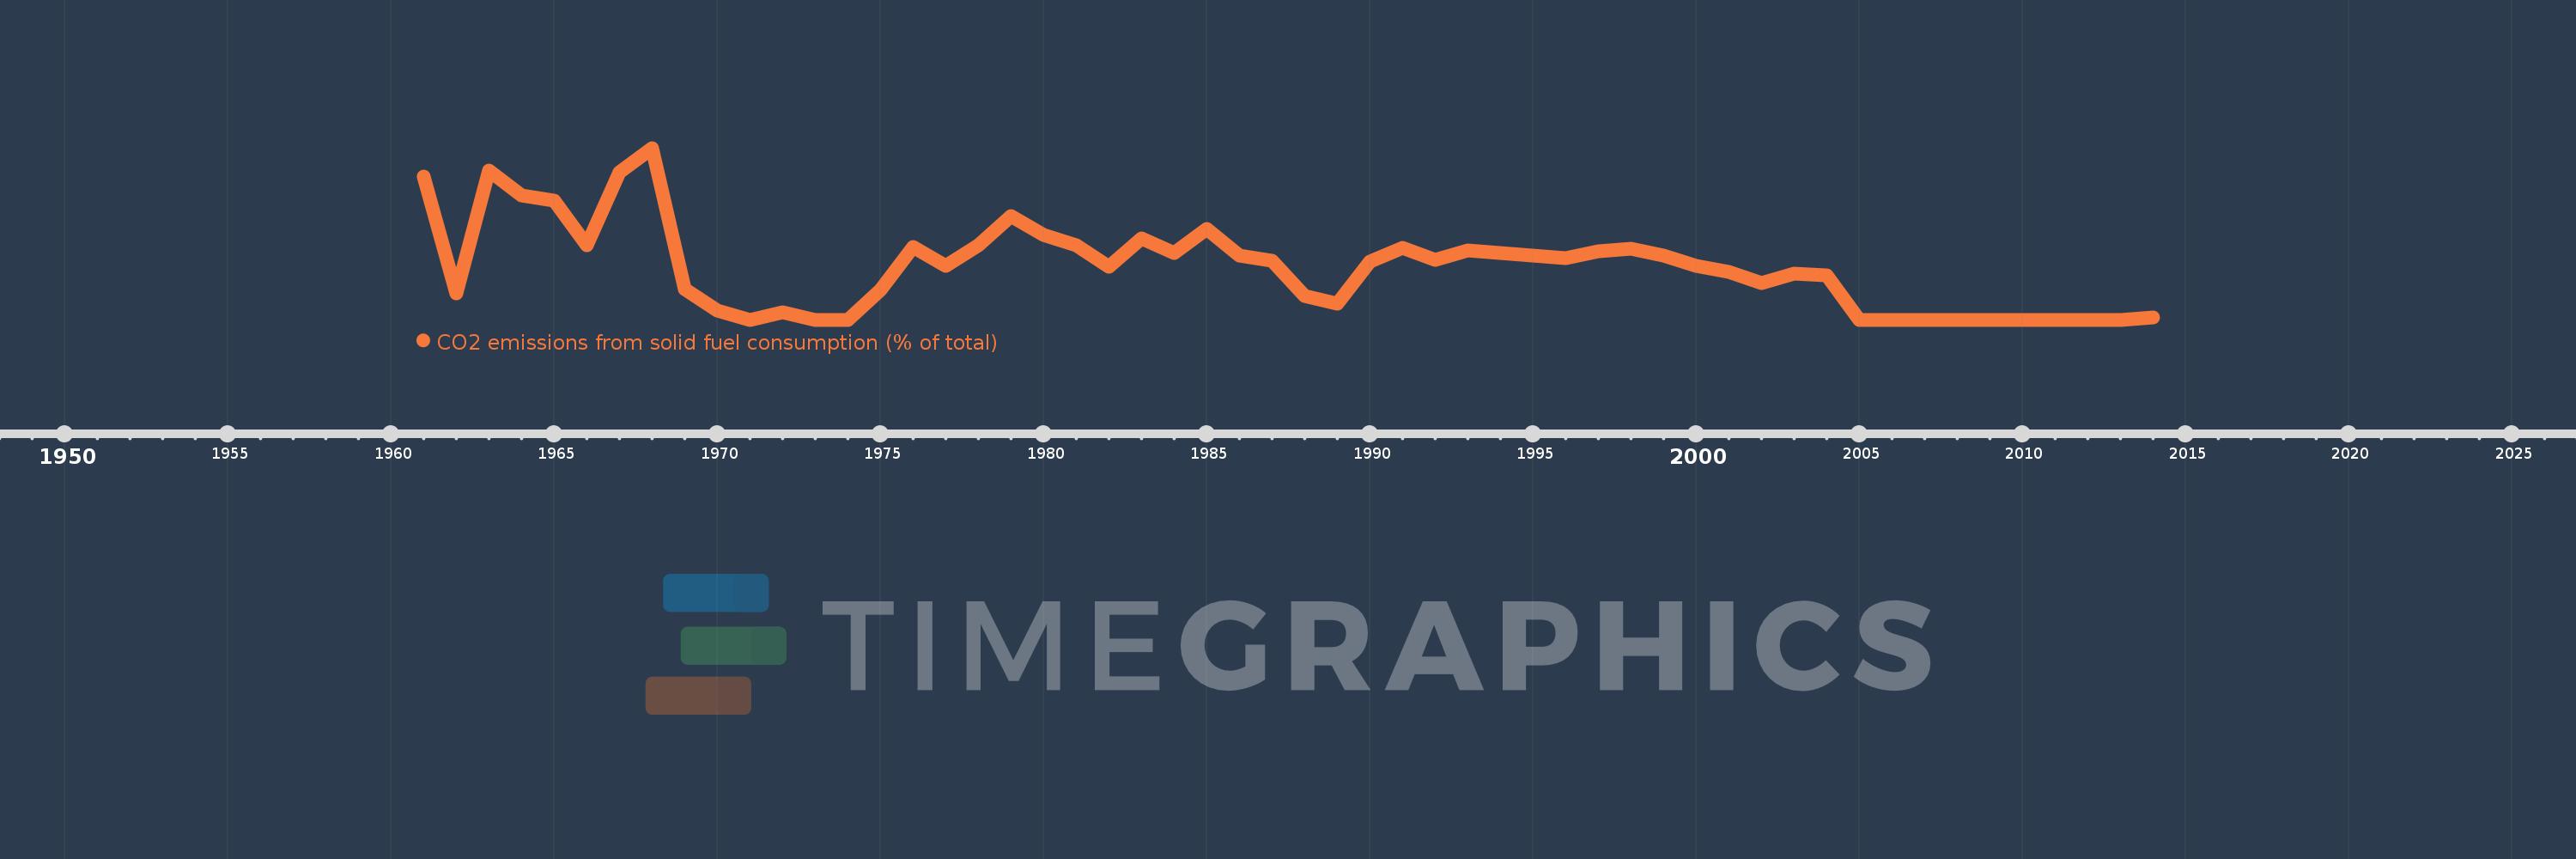
CO2 emissions from solid fuel consumption (% of total)
2014,2013,2012,2011,2010,2009,2008,2007,2006,2005,2004,2003,2002,2001,2000,1999,1998,1997,1996,1995,1994,1993,1992,1991,1990,1989,1988,1987,1986,1985,1984,1983,1982,1981,1980,1979,1978,1977,1976,1975,1974,1973,1972,1971,1970,1969,1968,1967,1966,1965,1964,1963,1962,1961
Queste statistiche in altri paesi:
AfghanistanAlbaniaAlgeriaAndorraAngolaAntigua and BarbudaArab WorldArgentinaArmeniaArubaAustraliaAustriaAzerbaijanBahamas, TheBahrainBangladeshBarbadosBelarusBelgiumBelizeBeninBermudaBhutanBoliviaBosnia and HerzegovinaBotswanaBrazilBritish Virgin IslandsBrunei DarussalamBulgariaBurkina FasoBurundiCabo VerdeCambodiaCameroonCanadaCaribbean small statesCayman IslandsCentral African RepublicCentral Europe and the BalticsChadChileChinaColombiaComorosCongo, Dem. Rep.Congo, Rep.Costa RicaCote d'IvoireCroatiaCubaCuracaoCyprusCzech RepublicDenmarkDjiboutiDominicaDominican RepublicEarly-demographic dividendEast Asia & PacificEast Asia & Pacific (excluding high income)East Asia & Pacific (IDA & IBRD countries)EcuadorEgypt, Arab Rep.El SalvadorEquatorial GuineaEritreaEstoniaEthiopiaEuro areaEurope & Central AsiaEurope & Central Asia (excluding high income)Europe & Central Asia (IDA & IBRD countries)European UnionFaroe IslandsFijiFinlandFragile and conflict affected situationsFranceFrench PolynesiaGabonGambia, TheGeorgiaGermanyGhanaGibraltarGreeceGreenlandGrenadaGuatemalaGuineaGuinea-BissauGuyanaHaitiHeavily indebted poor countries (HIPC)High incomeHondurasHong Kong SAR, ChinaHungaryIBRD onlyIcelandIDA & IBRD totalIDA blendIDA onlyIDA totalIndiaIndonesiaIran, Islamic Rep.IraqIrelandIsraelItalyJamaicaJapanJordanKazakhstanKenyaKiribatiKorea, Dem. People’s Rep.Korea, Rep.KuwaitKyrgyz RepublicLao PDRLate-demographic dividendLatin America & Caribbean Latin America & Caribbean (excluding high income)Latin America & the Caribbean (IDA & IBRD countries)LatviaLeast developed countries: UN classificationLebanonLesothoLiberiaLibyaLiechtensteinLithuaniaLow & middle incomeLow incomeLower middle incomeLuxembourgMacao SAR, ChinaMacedonia, FYRMadagascarMalawiMalaysiaMaldivesMaliMaltaMarshall IslandsMauritaniaMauritiusMexicoMicronesia, Fed. Sts.Middle East & North AfricaMiddle East & North Africa (excluding high income)Middle East & North Africa (IDA & IBRD countries)Middle incomeMoldovaMongoliaMontenegroMoroccoMozambiqueMyanmarNamibiaNauruNepalNetherlandsNew CaledoniaNew ZealandNicaraguaNigerNigeriaNorth AmericaNorwayOECD membersOmanOther small statesPacific island small statesPakistanPalauPanamaPapua New GuineaParaguayPeruPhilippinesPolandPortugalPost-demographic dividendPre-demographic dividendQatarRomaniaRussian FederationRwandaSamoaSao Tome and PrincipeSaudi ArabiaSenegalSerbiaSeychellesSierra LeoneSingaporeSint Maarten (Dutch part)Slovak RepublicSloveniaSmall statesSolomon IslandsSomaliaSouth AfricaSouth AsiaSouth Asia (IDA & IBRD)South SudanSpainSri LankaSt. Kitts and NevisSt. LuciaSt. Vincent and the GrenadinesSub-Saharan Africa Sub-Saharan Africa (excluding high income)Sub-Saharan Africa (IDA & IBRD countries)SudanSurinameSwazilandSwedenSwitzerlandSyrian Arab RepublicTajikistanTanzaniaThailandTimor-LesteTogoTongaTrinidad and TobagoTunisiaTurkeyTurkmenistanTurks and Caicos IslandsUgandaUkraineUnited Arab EmiratesUnited KingdomUnited StatesUpper middle incomeUruguayUzbekistanVanuatuVenezuela, RBVietnamWest Bank and GazaWorldYemen, Rep.ZambiaZimbabwe Linea del tempo:
Questa scala temporale mostra un grafico dal 1961 anno al 2014 anno. Pacific island small states. I dati fino ad 1960 anno non disponibili. Il numero di osservazioni attuali secondo i date: 54.
La fonte (nome):
Indicatori dello sviluppo mondiale
La fonte (organizzazione):
Carbon Dioxide Information Analysis Center, Environmental Sciences Division, Oak Ridge National Laboratory, Tennessee, United States.
Categorie:
Climate Change, Environment
sono stati aggiornati
23 apr 2017 anni
Indicatori delle variazioni dei valori per anni
Minima:
0.0
1 gen 1971 anni
Massimo:
8.939
1 gen 1968 anni
Alla data di osservazione
Valore
Variazione assoluta
La variazione rispetto al valore precedente
1 gen 1961 anni
7.463
+7.463
0.0%
1 gen 1962 anni
1.351
-6.111
-81.89%
1 gen 1963 anni
7.767
+6.416
474.76%
1 gen 1964 anni
6.481
-1.286
-16.55%
1 gen 1965 anni
6.215
-0.267
-4.12%
1 gen 1966 anni
3.871
-2.344
-37.71%
1 gen 1967 anni
7.692
+3.821
98.72%
1 gen 1968 anni
8.939
+1.246
16.2%
1 gen 1969 anni
1.579
-7.36
-82.34%
1 gen 1970 anni
0.481
-1.098
-69.55%
1 gen 1971 anni
0.0
-0.481
-100.0%
1 gen 1972 anni
0.369
+0.369
%
1 gen 1973 anni
0.0
-0.369
-100.0%
1 gen 1975 anni
1.553
+1.553
%
1 gen 1976 anni
3.797
+2.245
144.56%
1 gen 1977 anni
2.8
-0.997
-26.27%
1 gen 1978 anni
3.867
+1.067
38.12%
1 gen 1979 anni
5.405
+1.538
39.77%
1 gen 1980 anni
4.416
-0.99
-18.31%
1 gen 1981 anni
3.896
-0.519
-11.76%
1 gen 1982 anni
2.754
-1.142
-29.31%
1 gen 1983 anni
4.218
+1.464
53.16%
1 gen 1984 anni
3.457
-0.761
-18.04%
1 gen 1985 anni
4.706
+1.248
36.11%
1 gen 1986 anni
3.333
-1.373
-29.17%
1 gen 1987 anni
3.056
-0.278
-8.33%
1 gen 1988 anni
1.227
-1.829
-59.84%
1 gen 1989 anni
0.831
-0.396
-32.27%
1 gen 1990 anni
3.03
+2.199
264.65%
1 gen 1991 anni
3.753
+0.722
23.84%
1 gen 1992 anni
3.095
-0.658
-17.52%
1 gen 1993 anni
3.59
+0.495
15.98%
1 gen 1994 anni
3.465
-0.124
-3.47%
1 gen 1995 anni
3.349
-0.116
-3.35%
1 gen 1996 anni
3.196
-0.153
-4.57%
1 gen 1997 anni
3.563
+0.367
11.49%
1 gen 1998 anni
3.712
+0.149
4.18%
1 gen 1999 anni
3.333
-0.379
-10.21%
1 gen 2000 anni
2.802
-0.532
-15.95%
1 gen 2001 anni
2.479
-0.322
-11.51%
1 gen 2002 anni
1.893
-0.586
-23.64%
1 gen 2003 anni
2.381
+0.488
25.76%
1 gen 2004 anni
2.317
-0.064
-2.7%
1 gen 2005 anni
0.0
-2.317
-100.0%
1 gen 2014 anni
0.121
+0.121
%
Classificazione dei paesi secondo i statistiche attuali per anni


Commenti: