29
/it/
it
AIzaSyAYiBZKx7MnpbEhh9jyipgxe19OcubqV5w
April 1, 2024
121882
Dominican Republic
DOM
true
2
1
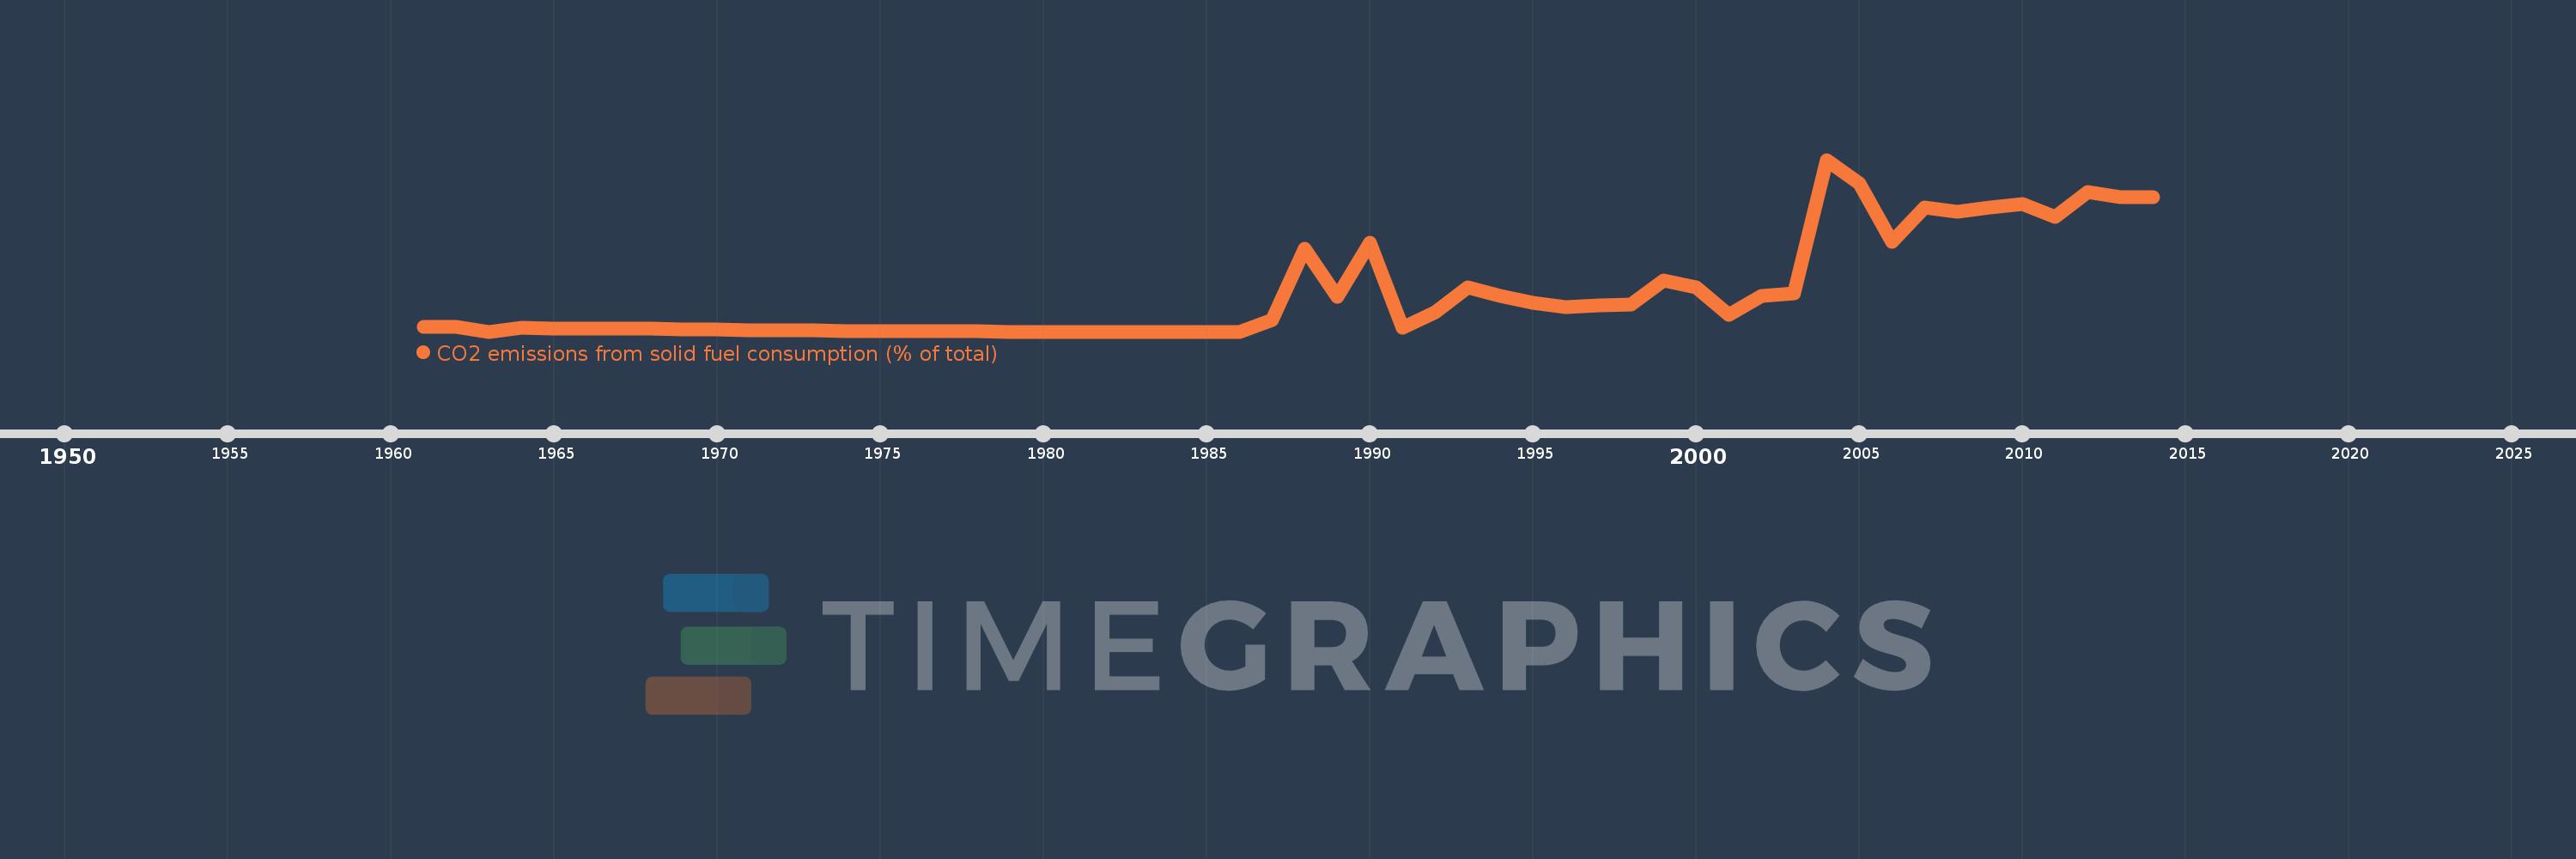
CO2 emissions from solid fuel consumption (% of total)
2014,2013,2012,2011,2010,2009,2008,2007,2006,2005,2004,2003,2002,2001,2000,1999,1998,1997,1996,1995,1994,1993,1992,1991,1990,1989,1988,1987,1986,1985,1984,1983,1982,1981,1980,1979,1978,1977,1976,1975,1974,1973,1972,1971,1970,1969,1968,1967,1966,1965,1964,1963,1962,1961
Queste statistiche in altri paesi:
AfghanistanAlbaniaAlgeriaAndorraAngolaAntigua and BarbudaArab WorldArgentinaArmeniaArubaAustraliaAustriaAzerbaijanBahamas, TheBahrainBangladeshBarbadosBelarusBelgiumBelizeBeninBermudaBhutanBoliviaBosnia and HerzegovinaBotswanaBrazilBritish Virgin IslandsBrunei DarussalamBulgariaBurkina FasoBurundiCabo VerdeCambodiaCameroonCanadaCaribbean small statesCayman IslandsCentral African RepublicCentral Europe and the BalticsChadChileChinaColombiaComorosCongo, Dem. Rep.Congo, Rep.Costa RicaCote d'IvoireCroatiaCubaCuracaoCyprusCzech RepublicDenmarkDjiboutiDominicaDominican RepublicEarly-demographic dividendEast Asia & PacificEast Asia & Pacific (excluding high income)East Asia & Pacific (IDA & IBRD countries)EcuadorEgypt, Arab Rep.El SalvadorEquatorial GuineaEritreaEstoniaEthiopiaEuro areaEurope & Central AsiaEurope & Central Asia (excluding high income)Europe & Central Asia (IDA & IBRD countries)European UnionFaroe IslandsFijiFinlandFragile and conflict affected situationsFranceFrench PolynesiaGabonGambia, TheGeorgiaGermanyGhanaGibraltarGreeceGreenlandGrenadaGuatemalaGuineaGuinea-BissauGuyanaHaitiHeavily indebted poor countries (HIPC)High incomeHondurasHong Kong SAR, ChinaHungaryIBRD onlyIcelandIDA & IBRD totalIDA blendIDA onlyIDA totalIndiaIndonesiaIran, Islamic Rep.IraqIrelandIsraelItalyJamaicaJapanJordanKazakhstanKenyaKiribatiKorea, Dem. People’s Rep.Korea, Rep.KuwaitKyrgyz RepublicLao PDRLate-demographic dividendLatin America & Caribbean Latin America & Caribbean (excluding high income)Latin America & the Caribbean (IDA & IBRD countries)LatviaLeast developed countries: UN classificationLebanonLesothoLiberiaLibyaLiechtensteinLithuaniaLow & middle incomeLow incomeLower middle incomeLuxembourgMacao SAR, ChinaMacedonia, FYRMadagascarMalawiMalaysiaMaldivesMaliMaltaMarshall IslandsMauritaniaMauritiusMexicoMicronesia, Fed. Sts.Middle East & North AfricaMiddle East & North Africa (excluding high income)Middle East & North Africa (IDA & IBRD countries)Middle incomeMoldovaMongoliaMontenegroMoroccoMozambiqueMyanmarNamibiaNauruNepalNetherlandsNew CaledoniaNew ZealandNicaraguaNigerNigeriaNorth AmericaNorwayOECD membersOmanOther small statesPacific island small statesPakistanPalauPanamaPapua New GuineaParaguayPeruPhilippinesPolandPortugalPost-demographic dividendPre-demographic dividendQatarRomaniaRussian FederationRwandaSamoaSao Tome and PrincipeSaudi ArabiaSenegalSerbiaSeychellesSierra LeoneSingaporeSint Maarten (Dutch part)Slovak RepublicSloveniaSmall statesSolomon IslandsSomaliaSouth AfricaSouth AsiaSouth Asia (IDA & IBRD)South SudanSpainSri LankaSt. Kitts and NevisSt. LuciaSt. Vincent and the GrenadinesSub-Saharan Africa Sub-Saharan Africa (excluding high income)Sub-Saharan Africa (IDA & IBRD countries)SudanSurinameSwazilandSwedenSwitzerlandSyrian Arab RepublicTajikistanTanzaniaThailandTimor-LesteTogoTongaTrinidad and TobagoTunisiaTurkeyTurkmenistanTurks and Caicos IslandsUgandaUkraineUnited Arab EmiratesUnited KingdomUnited StatesUpper middle incomeUruguayUzbekistanVanuatuVenezuela, RBVietnamWest Bank and GazaWorldYemen, Rep.ZambiaZimbabwe Linea del tempo:
Questa scala temporale mostra un grafico dal 1961 anno al 2014 anno. Dominican Republic. I dati fino ad 1960 anno non disponibili. Il numero di osservazioni attuali secondo i date: 54.
La fonte (nome):
Indicatori dello sviluppo mondiale
La fonte (organizzazione):
Carbon Dioxide Information Analysis Center, Environmental Sciences Division, Oak Ridge National Laboratory, Tennessee, United States.
Categorie:
Climate Change, Environment
sono stati aggiornati
23 apr 2017 anni
Indicatori delle variazioni dei valori per anni
Minima:
0.0
1 gen 1963 anni
Massimo:
13.039
1 gen 2004 anni
Alla data di osservazione
Valore
Variazione assoluta
La variazione rispetto al valore precedente
1 gen 1961 anni
0.352
+0.352
0.0%
1 gen 1962 anni
0.356
+0.004
1.07%
1 gen 1963 anni
0.0
-0.356
-100.0%
1 gen 1964 anni
0.293
+0.293
%
1 gen 1965 anni
0.21
-0.084
-28.51%
1 gen 1966 anni
0.237
+0.027
13.03%
1 gen 1967 anni
0.219
-0.018
-7.46%
1 gen 1968 anni
0.234
+0.014
6.54%
1 gen 1969 anni
0.156
-0.078
-33.23%
1 gen 1970 anni
0.138
-0.018
-11.46%
1 gen 1971 anni
0.118
-0.02
-14.62%
1 gen 1972 anni
0.104
-0.014
-11.76%
1 gen 1973 anni
0.078
-0.026
-24.63%
1 gen 1974 anni
0.061
-0.017
-21.63%
1 gen 1975 anni
0.057
-0.004
-7.03%
1 gen 1976 anni
0.058
+0.001
1.21%
1 gen 1977 anni
0.058
+0.0
0.12%
1 gen 1978 anni
0.065
+0.007
12.8%
1 gen 1979 anni
0.0
-0.065
-100.0%
1 gen 1987 anni
0.896
+0.896
%
1 gen 1988 anni
6.316
+5.419
604.53%
1 gen 1989 anni
2.61
-3.706
-58.68%
1 gen 1990 anni
6.721
+4.111
157.51%
1 gen 1991 anni
0.278
-6.443
-95.86%
1 gen 1992 anni
1.497
+1.219
438.24%
1 gen 1993 anni
3.39
+1.894
126.5%
1 gen 1994 anni
2.712
-0.678
-20.01%
1 gen 1995 anni
2.205
-0.507
-18.71%
1 gen 1996 anni
1.847
-0.358
-16.23%
1 gen 1997 anni
1.968
+0.122
6.58%
1 gen 1998 anni
2.057
+0.089
4.53%
1 gen 1999 anni
3.907
+1.849
89.88%
1 gen 2000 anni
3.339
-0.568
-14.54%
1 gen 2001 anni
1.241
-2.097
-62.82%
1 gen 2002 anni
2.72
+1.479
119.12%
1 gen 2003 anni
2.905
+0.185
6.8%
1 gen 2004 anni
13.039
+10.134
348.81%
1 gen 2005 anni
11.276
-1.763
-13.52%
1 gen 2006 anni
6.787
-4.488
-39.81%
1 gen 2007 anni
9.453
+2.666
39.28%
1 gen 2008 anni
9.127
-0.326
-3.45%
1 gen 2009 anni
9.444
+0.317
3.47%
1 gen 2010 anni
9.649
+0.205
2.17%
1 gen 2011 anni
8.689
-0.96
-9.95%
1 gen 2012 anni
10.611
+1.922
22.12%
1 gen 2013 anni
10.205
-0.406
-3.83%
1 gen 2014 anni
10.218
+0.013
0.13%
Classificazione dei paesi secondo i statistiche attuali per anni


Commenti: