29
/it/
it
AIzaSyAYiBZKx7MnpbEhh9jyipgxe19OcubqV5w
April 1, 2024
25556
Central Europe and the Baltics
CEB
false
2
1
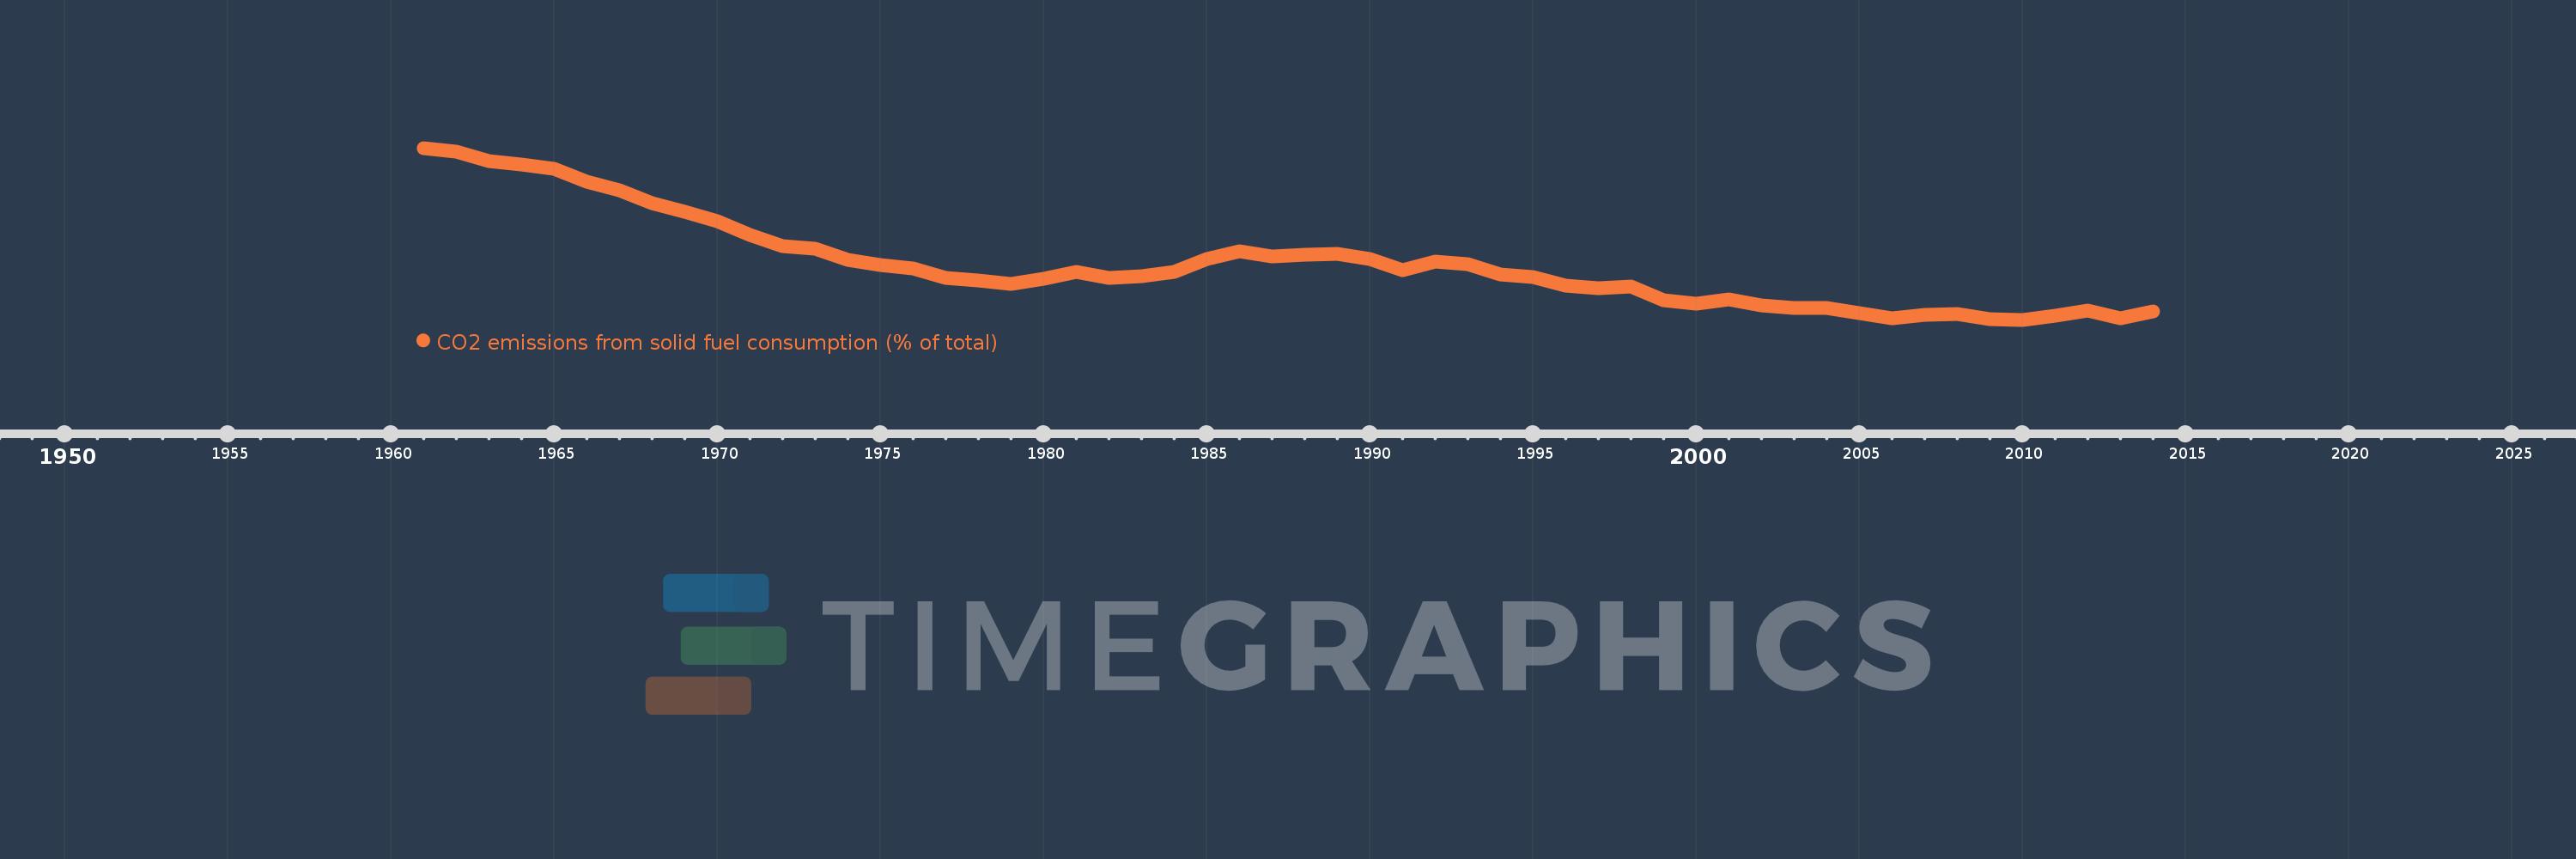
CO2 emissions from solid fuel consumption (% of total)
2014,2013,2012,2011,2010,2009,2008,2007,2006,2005,2004,2003,2002,2001,2000,1999,1998,1997,1996,1995,1994,1993,1992,1991,1990,1989,1988,1987,1986,1985,1984,1983,1982,1981,1980,1979,1978,1977,1976,1975,1974,1973,1972,1971,1970,1969,1968,1967,1966,1965,1964,1963,1962,1961
Queste statistiche in altri paesi:
AfghanistanAlbaniaAlgeriaAndorraAngolaAntigua and BarbudaArab WorldArgentinaArmeniaArubaAustraliaAustriaAzerbaijanBahamas, TheBahrainBangladeshBarbadosBelarusBelgiumBelizeBeninBermudaBhutanBoliviaBosnia and HerzegovinaBotswanaBrazilBritish Virgin IslandsBrunei DarussalamBulgariaBurkina FasoBurundiCabo VerdeCambodiaCameroonCanadaCaribbean small statesCayman IslandsCentral African RepublicCentral Europe and the BalticsChadChileChinaColombiaComorosCongo, Dem. Rep.Congo, Rep.Costa RicaCote d'IvoireCroatiaCubaCuracaoCyprusCzech RepublicDenmarkDjiboutiDominicaDominican RepublicEarly-demographic dividendEast Asia & PacificEast Asia & Pacific (excluding high income)East Asia & Pacific (IDA & IBRD countries)EcuadorEgypt, Arab Rep.El SalvadorEquatorial GuineaEritreaEstoniaEthiopiaEuro areaEurope & Central AsiaEurope & Central Asia (excluding high income)Europe & Central Asia (IDA & IBRD countries)European UnionFaroe IslandsFijiFinlandFragile and conflict affected situationsFranceFrench PolynesiaGabonGambia, TheGeorgiaGermanyGhanaGibraltarGreeceGreenlandGrenadaGuatemalaGuineaGuinea-BissauGuyanaHaitiHeavily indebted poor countries (HIPC)High incomeHondurasHong Kong SAR, ChinaHungaryIBRD onlyIcelandIDA & IBRD totalIDA blendIDA onlyIDA totalIndiaIndonesiaIran, Islamic Rep.IraqIrelandIsraelItalyJamaicaJapanJordanKazakhstanKenyaKiribatiKorea, Dem. People’s Rep.Korea, Rep.KuwaitKyrgyz RepublicLao PDRLate-demographic dividendLatin America & Caribbean Latin America & Caribbean (excluding high income)Latin America & the Caribbean (IDA & IBRD countries)LatviaLeast developed countries: UN classificationLebanonLesothoLiberiaLibyaLiechtensteinLithuaniaLow & middle incomeLow incomeLower middle incomeLuxembourgMacao SAR, ChinaMacedonia, FYRMadagascarMalawiMalaysiaMaldivesMaliMaltaMarshall IslandsMauritaniaMauritiusMexicoMicronesia, Fed. Sts.Middle East & North AfricaMiddle East & North Africa (excluding high income)Middle East & North Africa (IDA & IBRD countries)Middle incomeMoldovaMongoliaMontenegroMoroccoMozambiqueMyanmarNamibiaNauruNepalNetherlandsNew CaledoniaNew ZealandNicaraguaNigerNigeriaNorth AmericaNorwayOECD membersOmanOther small statesPacific island small statesPakistanPalauPanamaPapua New GuineaParaguayPeruPhilippinesPolandPortugalPost-demographic dividendPre-demographic dividendQatarRomaniaRussian FederationRwandaSamoaSao Tome and PrincipeSaudi ArabiaSenegalSerbiaSeychellesSierra LeoneSingaporeSint Maarten (Dutch part)Slovak RepublicSloveniaSmall statesSolomon IslandsSomaliaSouth AfricaSouth AsiaSouth Asia (IDA & IBRD)South SudanSpainSri LankaSt. Kitts and NevisSt. LuciaSt. Vincent and the GrenadinesSub-Saharan Africa Sub-Saharan Africa (excluding high income)Sub-Saharan Africa (IDA & IBRD countries)SudanSurinameSwazilandSwedenSwitzerlandSyrian Arab RepublicTajikistanTanzaniaThailandTimor-LesteTogoTongaTrinidad and TobagoTunisiaTurkeyTurkmenistanTurks and Caicos IslandsUgandaUkraineUnited Arab EmiratesUnited KingdomUnited StatesUpper middle incomeUruguayUzbekistanVanuatuVenezuela, RBVietnamWest Bank and GazaWorldYemen, Rep.ZambiaZimbabwe Linea del tempo:
Questa scala temporale mostra un grafico dal 1961 anno al 2014 anno. Central Europe and the Baltics. I dati fino ad 1960 anno non disponibili. Il numero di osservazioni attuali secondo i date: 54.
La fonte (nome):
Indicatori dello sviluppo mondiale
La fonte (organizzazione):
Carbon Dioxide Information Analysis Center, Environmental Sciences Division, Oak Ridge National Laboratory, Tennessee, United States.
Categorie:
Climate Change, Environment
sono stati aggiornati
23 apr 2017 anni
Indicatori delle variazioni dei valori per anni
Minima:
54.101
1 gen 2010 anni
Massimo:
80.834
1 gen 1961 anni
Alla data di osservazione
Valore
Variazione assoluta
La variazione rispetto al valore precedente
1 gen 1961 anni
80.834
+80.834
0.0%
1 gen 1962 anni
80.263
-0.572
-0.71%
1 gen 1963 anni
78.837
-1.426
-1.78%
1 gen 1964 anni
78.267
-0.57
-0.72%
1 gen 1965 anni
77.524
-0.743
-0.95%
1 gen 1966 anni
75.632
-1.892
-2.44%
1 gen 1967 anni
74.308
-1.324
-1.75%
1 gen 1968 anni
72.221
-2.087
-2.81%
1 gen 1969 anni
70.896
-1.325
-1.83%
1 gen 1970 anni
69.432
-1.464
-2.06%
1 gen 1971 anni
67.254
-2.178
-3.14%
1 gen 1972 anni
65.567
-1.687
-2.51%
1 gen 1973 anni
65.207
-0.36
-0.55%
1 gen 1974 anni
63.399
-1.808
-2.77%
1 gen 1975 anni
62.612
-0.787
-1.24%
1 gen 1976 anni
62.059
-0.553
-0.88%
1 gen 1977 anni
60.609
-1.45
-2.34%
1 gen 1978 anni
60.185
-0.424
-0.7%
1 gen 1979 anni
59.626
-0.559
-0.93%
1 gen 1980 anni
60.444
+0.818
1.37%
1 gen 1981 anni
61.54
+1.096
1.81%
1 gen 1982 anni
60.676
-0.864
-1.4%
1 gen 1983 anni
60.935
+0.259
0.43%
1 gen 1984 anni
61.5
+0.565
0.93%
1 gen 1985 anni
63.551
+2.051
3.34%
1 gen 1986 anni
64.698
+1.147
1.8%
1 gen 1987 anni
63.939
-0.759
-1.17%
1 gen 1988 anni
64.205
+0.266
0.42%
1 gen 1989 anni
64.388
+0.183
0.29%
1 gen 1990 anni
63.613
-0.776
-1.2%
1 gen 1991 anni
61.761
-1.851
-2.91%
1 gen 1992 anni
63.151
+1.39
2.25%
1 gen 1993 anni
62.729
-0.422
-0.67%
1 gen 1994 anni
61.154
-1.575
-2.51%
1 gen 1995 anni
60.714
-0.44
-0.72%
1 gen 1996 anni
59.35
-1.364
-2.25%
1 gen 1997 anni
58.951
-0.399
-0.67%
1 gen 1998 anni
59.338
+0.386
0.66%
1 gen 1999 anni
57.094
-2.244
-3.78%
1 gen 2000 anni
56.592
-0.502
-0.88%
1 gen 2001 anni
57.303
+0.711
1.26%
1 gen 2002 anni
56.313
-0.99
-1.73%
1 gen 2003 anni
55.899
-0.415
-0.74%
1 gen 2004 anni
55.881
-0.018
-0.03%
1 gen 2005 anni
55.073
-0.807
-1.44%
1 gen 2006 anni
54.298
-0.776
-1.41%
1 gen 2007 anni
54.913
+0.616
1.13%
1 gen 2008 anni
54.954
+0.041
0.07%
1 gen 2009 anni
54.255
-0.699
-1.27%
1 gen 2010 anni
54.101
-0.154
-0.28%
1 gen 2011 anni
54.67
+0.57
1.05%
1 gen 2012 anni
55.525
+0.854
1.56%
1 gen 2013 anni
54.295
-1.229
-2.21%
1 gen 2014 anni
55.368
+1.072
1.97%
Classificazione dei paesi secondo i statistiche attuali per anni


Commenti: