29
/it/
it
AIzaSyAYiBZKx7MnpbEhh9jyipgxe19OcubqV5w
April 1, 2024
198868
Mongolia
MNG
true
2
1
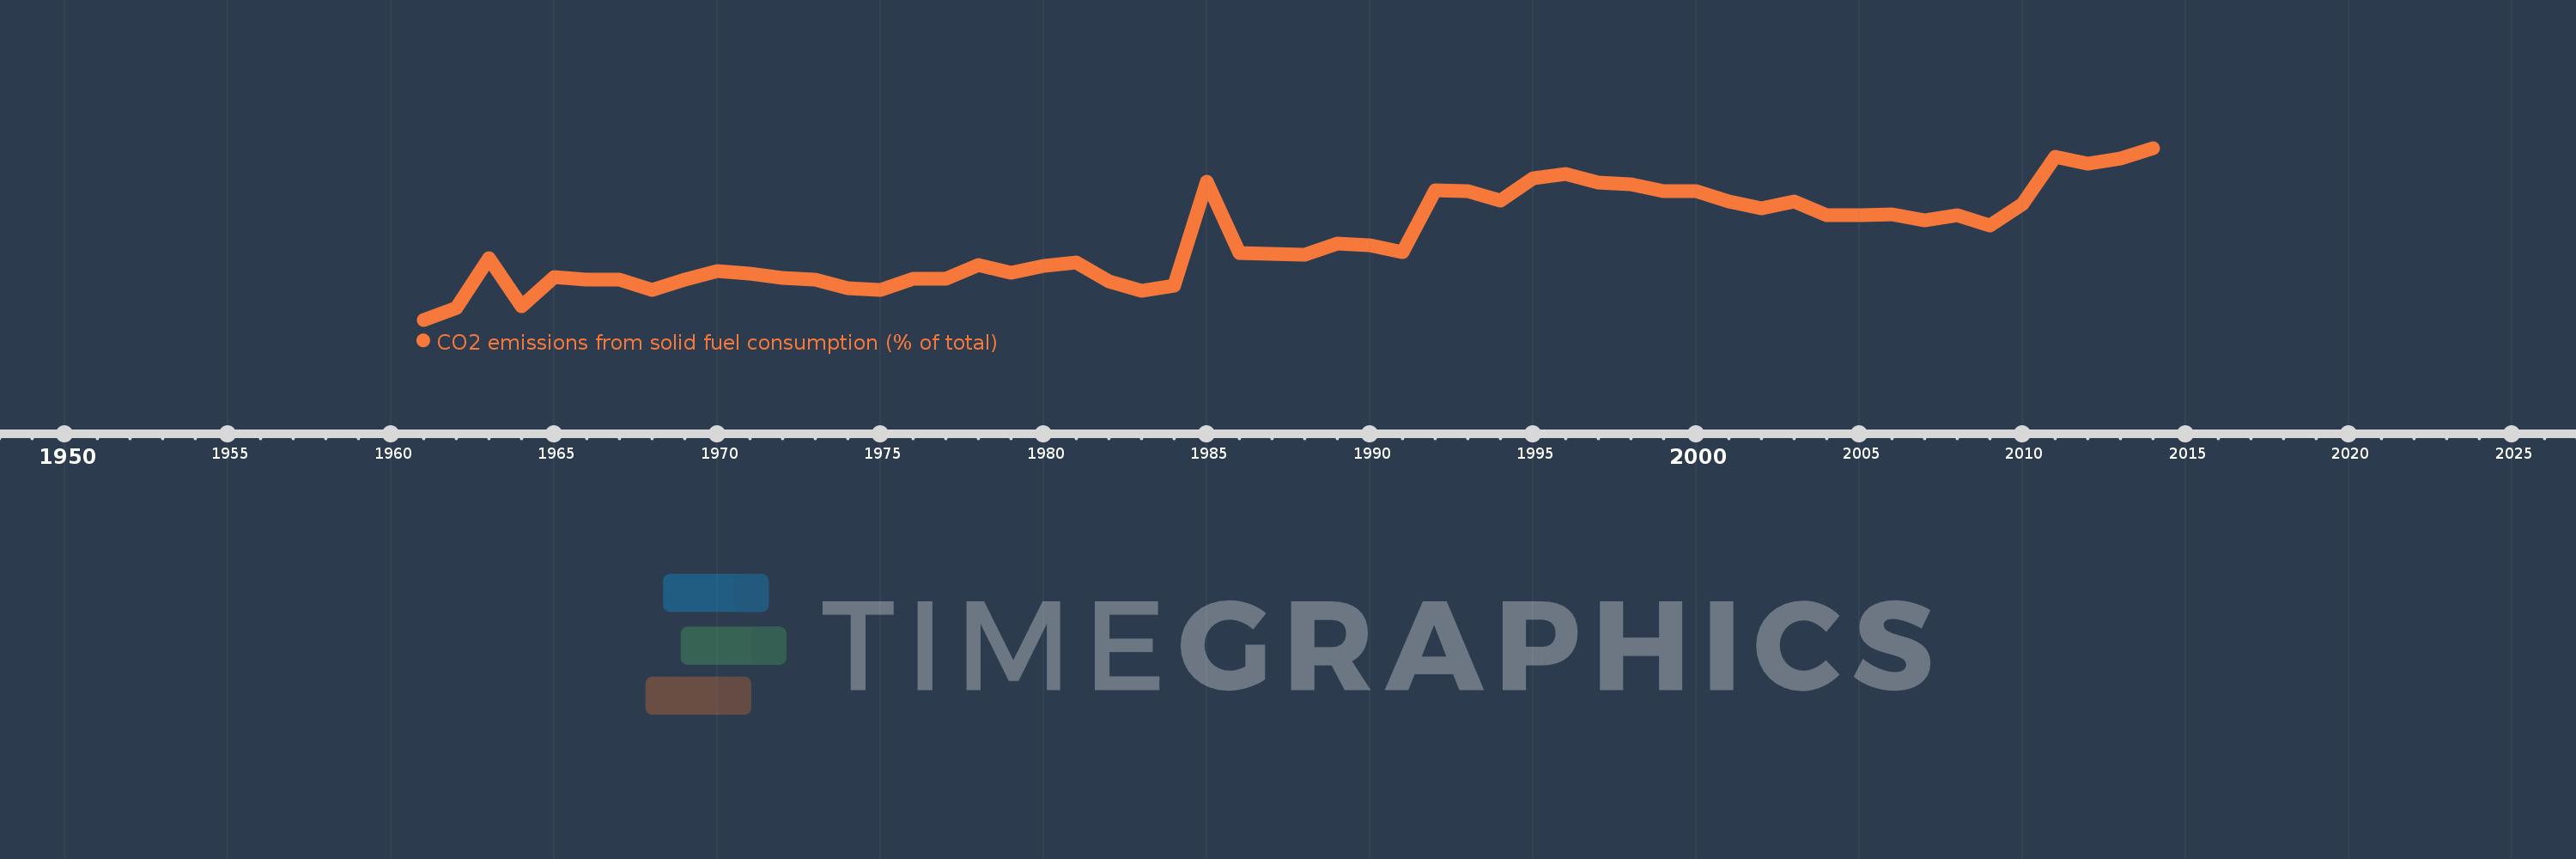
CO2 emissions from solid fuel consumption (% of total)
2014,2013,2012,2011,2010,2009,2008,2007,2006,2005,2004,2003,2002,2001,2000,1999,1998,1997,1996,1995,1994,1993,1992,1991,1990,1989,1988,1987,1986,1985,1984,1983,1982,1981,1980,1979,1978,1977,1976,1975,1974,1973,1972,1971,1970,1969,1968,1967,1966,1965,1964,1963,1962,1961
Queste statistiche in altri paesi:
AfghanistanAlbaniaAlgeriaAndorraAngolaAntigua and BarbudaArab WorldArgentinaArmeniaArubaAustraliaAustriaAzerbaijanBahamas, TheBahrainBangladeshBarbadosBelarusBelgiumBelizeBeninBermudaBhutanBoliviaBosnia and HerzegovinaBotswanaBrazilBritish Virgin IslandsBrunei DarussalamBulgariaBurkina FasoBurundiCabo VerdeCambodiaCameroonCanadaCaribbean small statesCayman IslandsCentral African RepublicCentral Europe and the BalticsChadChileChinaColombiaComorosCongo, Dem. Rep.Congo, Rep.Costa RicaCote d'IvoireCroatiaCubaCuracaoCyprusCzech RepublicDenmarkDjiboutiDominicaDominican RepublicEarly-demographic dividendEast Asia & PacificEast Asia & Pacific (excluding high income)East Asia & Pacific (IDA & IBRD countries)EcuadorEgypt, Arab Rep.El SalvadorEquatorial GuineaEritreaEstoniaEthiopiaEuro areaEurope & Central AsiaEurope & Central Asia (excluding high income)Europe & Central Asia (IDA & IBRD countries)European UnionFaroe IslandsFijiFinlandFragile and conflict affected situationsFranceFrench PolynesiaGabonGambia, TheGeorgiaGermanyGhanaGibraltarGreeceGreenlandGrenadaGuatemalaGuineaGuinea-BissauGuyanaHaitiHeavily indebted poor countries (HIPC)High incomeHondurasHong Kong SAR, ChinaHungaryIBRD onlyIcelandIDA & IBRD totalIDA blendIDA onlyIDA totalIndiaIndonesiaIran, Islamic Rep.IraqIrelandIsraelItalyJamaicaJapanJordanKazakhstanKenyaKiribatiKorea, Dem. People’s Rep.Korea, Rep.KuwaitKyrgyz RepublicLao PDRLate-demographic dividendLatin America & Caribbean Latin America & Caribbean (excluding high income)Latin America & the Caribbean (IDA & IBRD countries)LatviaLeast developed countries: UN classificationLebanonLesothoLiberiaLibyaLiechtensteinLithuaniaLow & middle incomeLow incomeLower middle incomeLuxembourgMacao SAR, ChinaMacedonia, FYRMadagascarMalawiMalaysiaMaldivesMaliMaltaMarshall IslandsMauritaniaMauritiusMexicoMicronesia, Fed. Sts.Middle East & North AfricaMiddle East & North Africa (excluding high income)Middle East & North Africa (IDA & IBRD countries)Middle incomeMoldovaMongoliaMontenegroMoroccoMozambiqueMyanmarNamibiaNauruNepalNetherlandsNew CaledoniaNew ZealandNicaraguaNigerNigeriaNorth AmericaNorwayOECD membersOmanOther small statesPacific island small statesPakistanPalauPanamaPapua New GuineaParaguayPeruPhilippinesPolandPortugalPost-demographic dividendPre-demographic dividendQatarRomaniaRussian FederationRwandaSamoaSao Tome and PrincipeSaudi ArabiaSenegalSerbiaSeychellesSierra LeoneSingaporeSint Maarten (Dutch part)Slovak RepublicSloveniaSmall statesSolomon IslandsSomaliaSouth AfricaSouth AsiaSouth Asia (IDA & IBRD)South SudanSpainSri LankaSt. Kitts and NevisSt. LuciaSt. Vincent and the GrenadinesSub-Saharan Africa Sub-Saharan Africa (excluding high income)Sub-Saharan Africa (IDA & IBRD countries)SudanSurinameSwazilandSwedenSwitzerlandSyrian Arab RepublicTajikistanTanzaniaThailandTimor-LesteTogoTongaTrinidad and TobagoTunisiaTurkeyTurkmenistanTurks and Caicos IslandsUgandaUkraineUnited Arab EmiratesUnited KingdomUnited StatesUpper middle incomeUruguayUzbekistanVanuatuVenezuela, RBVietnamWest Bank and GazaWorldYemen, Rep.ZambiaZimbabwe Linea del tempo:
Questa scala temporale mostra un grafico dal 1961 anno al 2014 anno. Mongolia. I dati fino ad 1960 anno non disponibili. Il numero di osservazioni attuali secondo i date: 54.
La fonte (nome):
Indicatori dello sviluppo mondiale
La fonte (organizzazione):
Carbon Dioxide Information Analysis Center, Environmental Sciences Division, Oak Ridge National Laboratory, Tennessee, United States.
Categorie:
Climate Change, Environment
sono stati aggiornati
23 apr 2017 anni
Indicatori delle variazioni dei valori per anni
Minima:
61.756
1 gen 1961 anni
Massimo:
90.831
1 gen 2014 anni
Alla data di osservazione
Valore
Variazione assoluta
La variazione rispetto al valore precedente
1 gen 1961 anni
61.756
+61.756
0.0%
1 gen 1962 anni
63.684
+1.928
3.12%
1 gen 1963 anni
72.119
+8.435
13.24%
1 gen 1964 anni
64.073
-8.046
-11.16%
1 gen 1965 anni
68.996
+4.923
7.68%
1 gen 1966 anni
68.539
-0.457
-0.66%
1 gen 1967 anni
68.48
-0.059
-0.09%
1 gen 1968 anni
66.78
-1.7
-2.48%
1 gen 1969 anni
68.538
+1.757
2.63%
1 gen 1970 anni
69.945
+1.408
2.05%
1 gen 1971 anni
69.498
-0.447
-0.64%
1 gen 1972 anni
68.841
-0.657
-0.95%
1 gen 1973 anni
68.492
-0.349
-0.51%
1 gen 1974 anni
67.123
-1.368
-2.0%
1 gen 1975 anni
66.764
-0.359
-0.53%
1 gen 1976 anni
68.62
+1.856
2.78%
1 gen 1977 anni
68.693
+0.072
0.11%
1 gen 1978 anni
70.944
+2.251
3.28%
1 gen 1979 anni
69.689
-1.255
-1.77%
1 gen 1980 anni
70.838
+1.149
1.65%
1 gen 1981 anni
71.429
+0.59
0.83%
1 gen 1982 anni
68.267
-3.161
-4.43%
1 gen 1983 anni
66.649
-1.619
-2.37%
1 gen 1984 anni
67.505
+0.857
1.29%
1 gen 1985 anni
85.105
+17.6
26.07%
1 gen 1986 anni
73.03
-12.075
-14.19%
1 gen 1987 anni
72.934
-0.096
-0.13%
1 gen 1988 anni
72.705
-0.229
-0.31%
1 gen 1989 anni
74.7
+1.994
2.74%
1 gen 1990 anni
74.323
-0.376
-0.5%
1 gen 1991 anni
73.201
-1.122
-1.51%
1 gen 1992 anni
83.715
+10.514
14.36%
1 gen 1993 anni
83.527
-0.188
-0.22%
1 gen 1994 anni
81.872
-1.655
-1.98%
1 gen 1995 anni
85.648
+3.776
4.61%
1 gen 1996 anni
86.435
+0.787
0.92%
1 gen 1997 anni
85.043
-1.392
-1.61%
1 gen 1998 anni
84.681
-0.362
-0.43%
1 gen 1999 anni
83.539
-1.142
-1.35%
1 gen 2000 anni
83.447
-0.093
-0.11%
1 gen 2001 anni
81.778
-1.668
-2.0%
1 gen 2002 anni
80.651
-1.127
-1.38%
1 gen 2003 anni
81.814
+1.163
1.44%
1 gen 2004 anni
79.507
-2.307
-2.82%
1 gen 2005 anni
79.503
-0.005
-0.01%
1 gen 2006 anni
79.615
+0.112
0.14%
1 gen 2007 anni
78.532
-1.082
-1.36%
1 gen 2008 anni
79.392
+0.86
1.09%
1 gen 2009 anni
77.642
-1.75
-2.2%
1 gen 2010 anni
81.304
+3.662
4.72%
1 gen 2011 anni
89.323
+8.019
9.86%
1 gen 2012 anni
88.221
-1.102
-1.23%
1 gen 2013 anni
89.064
+0.843
0.96%
1 gen 2014 anni
90.831
+1.766
1.98%
Classificazione dei paesi secondo i statistiche attuali per anni


Commenti: