29
/it/
it
AIzaSyAYiBZKx7MnpbEhh9jyipgxe19OcubqV5w
April 1, 2024
202665
Mozambique
MOZ
true
2
1
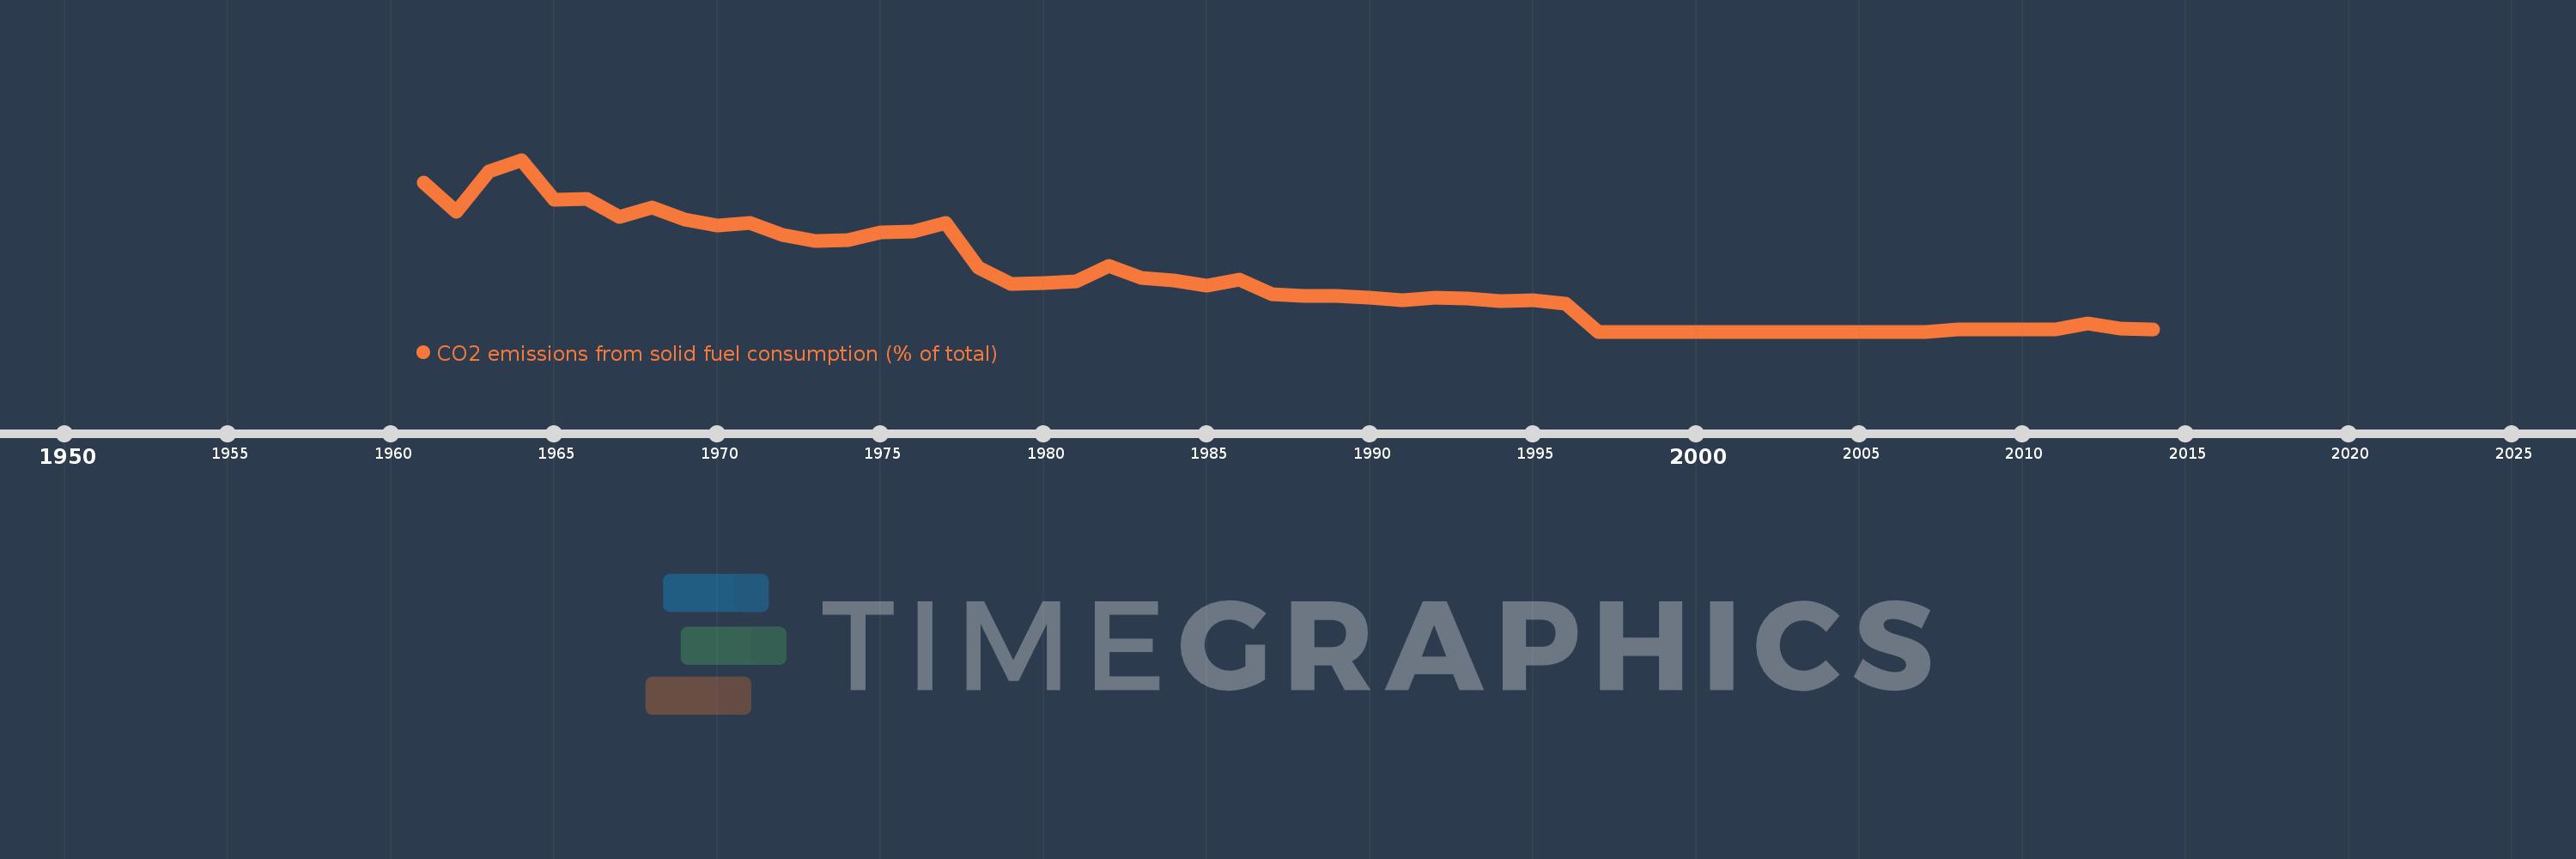
CO2 emissions from solid fuel consumption (% of total)
2014,2013,2012,2011,2010,2009,2008,2007,2006,2005,2004,2003,2002,2001,2000,1999,1998,1997,1996,1995,1994,1993,1992,1991,1990,1989,1988,1987,1986,1985,1984,1983,1982,1981,1980,1979,1978,1977,1976,1975,1974,1973,1972,1971,1970,1969,1968,1967,1966,1965,1964,1963,1962,1961
Queste statistiche in altri paesi:
AfghanistanAlbaniaAlgeriaAndorraAngolaAntigua and BarbudaArab WorldArgentinaArmeniaArubaAustraliaAustriaAzerbaijanBahamas, TheBahrainBangladeshBarbadosBelarusBelgiumBelizeBeninBermudaBhutanBoliviaBosnia and HerzegovinaBotswanaBrazilBritish Virgin IslandsBrunei DarussalamBulgariaBurkina FasoBurundiCabo VerdeCambodiaCameroonCanadaCaribbean small statesCayman IslandsCentral African RepublicCentral Europe and the BalticsChadChileChinaColombiaComorosCongo, Dem. Rep.Congo, Rep.Costa RicaCote d'IvoireCroatiaCubaCuracaoCyprusCzech RepublicDenmarkDjiboutiDominicaDominican RepublicEarly-demographic dividendEast Asia & PacificEast Asia & Pacific (excluding high income)East Asia & Pacific (IDA & IBRD countries)EcuadorEgypt, Arab Rep.El SalvadorEquatorial GuineaEritreaEstoniaEthiopiaEuro areaEurope & Central AsiaEurope & Central Asia (excluding high income)Europe & Central Asia (IDA & IBRD countries)European UnionFaroe IslandsFijiFinlandFragile and conflict affected situationsFranceFrench PolynesiaGabonGambia, TheGeorgiaGermanyGhanaGibraltarGreeceGreenlandGrenadaGuatemalaGuineaGuinea-BissauGuyanaHaitiHeavily indebted poor countries (HIPC)High incomeHondurasHong Kong SAR, ChinaHungaryIBRD onlyIcelandIDA & IBRD totalIDA blendIDA onlyIDA totalIndiaIndonesiaIran, Islamic Rep.IraqIrelandIsraelItalyJamaicaJapanJordanKazakhstanKenyaKiribatiKorea, Dem. People’s Rep.Korea, Rep.KuwaitKyrgyz RepublicLao PDRLate-demographic dividendLatin America & Caribbean Latin America & Caribbean (excluding high income)Latin America & the Caribbean (IDA & IBRD countries)LatviaLeast developed countries: UN classificationLebanonLesothoLiberiaLibyaLiechtensteinLithuaniaLow & middle incomeLow incomeLower middle incomeLuxembourgMacao SAR, ChinaMacedonia, FYRMadagascarMalawiMalaysiaMaldivesMaliMaltaMarshall IslandsMauritaniaMauritiusMexicoMicronesia, Fed. Sts.Middle East & North AfricaMiddle East & North Africa (excluding high income)Middle East & North Africa (IDA & IBRD countries)Middle incomeMoldovaMongoliaMontenegroMoroccoMozambiqueMyanmarNamibiaNauruNepalNetherlandsNew CaledoniaNew ZealandNicaraguaNigerNigeriaNorth AmericaNorwayOECD membersOmanOther small statesPacific island small statesPakistanPalauPanamaPapua New GuineaParaguayPeruPhilippinesPolandPortugalPost-demographic dividendPre-demographic dividendQatarRomaniaRussian FederationRwandaSamoaSao Tome and PrincipeSaudi ArabiaSenegalSerbiaSeychellesSierra LeoneSingaporeSint Maarten (Dutch part)Slovak RepublicSloveniaSmall statesSolomon IslandsSomaliaSouth AfricaSouth AsiaSouth Asia (IDA & IBRD)South SudanSpainSri LankaSt. Kitts and NevisSt. LuciaSt. Vincent and the GrenadinesSub-Saharan Africa Sub-Saharan Africa (excluding high income)Sub-Saharan Africa (IDA & IBRD countries)SudanSurinameSwazilandSwedenSwitzerlandSyrian Arab RepublicTajikistanTanzaniaThailandTimor-LesteTogoTongaTrinidad and TobagoTunisiaTurkeyTurkmenistanTurks and Caicos IslandsUgandaUkraineUnited Arab EmiratesUnited KingdomUnited StatesUpper middle incomeUruguayUzbekistanVanuatuVenezuela, RBVietnamWest Bank and GazaWorldYemen, Rep.ZambiaZimbabwe Linea del tempo:
Questa scala temporale mostra un grafico dal 1961 anno al 2014 anno. Mozambique. I dati fino ad 1960 anno non disponibili. Il numero di osservazioni attuali secondo i date: 54.
La fonte (nome):
Indicatori dello sviluppo mondiale
La fonte (organizzazione):
Carbon Dioxide Information Analysis Center, Environmental Sciences Division, Oak Ridge National Laboratory, Tennessee, United States.
Categorie:
Climate Change, Environment
sono stati aggiornati
23 apr 2017 anni
Indicatori delle variazioni dei valori per anni
Minima:
0.0
1 gen 1997 anni
Massimo:
81.898
1 gen 1964 anni
Alla data di osservazione
Valore
Variazione assoluta
La variazione rispetto al valore precedente
1 gen 1961 anni
71.012
+71.012
0.0%
1 gen 1962 anni
56.964
-14.048
-19.78%
1 gen 1963 anni
76.568
+19.604
34.42%
1 gen 1964 anni
81.898
+5.33
6.96%
1 gen 1965 anni
62.671
-19.227
-23.48%
1 gen 1966 anni
63.254
+0.583
0.93%
1 gen 1967 anni
54.655
-8.599
-13.59%
1 gen 1968 anni
59.295
+4.64
8.49%
1 gen 1969 anni
53.298
-5.997
-10.11%
1 gen 1970 anni
50.679
-2.619
-4.91%
1 gen 1971 anni
51.72
+1.041
2.05%
1 gen 1972 anni
45.943
-5.777
-11.17%
1 gen 1973 anni
43.222
-2.721
-5.92%
1 gen 1974 anni
43.724
+0.502
1.16%
1 gen 1975 anni
47.497
+3.773
8.63%
1 gen 1976 anni
47.522
+0.025
0.05%
1 gen 1977 anni
51.719
+4.197
8.83%
1 gen 1978 anni
30.676
-21.044
-40.69%
1 gen 1979 anni
22.832
-7.844
-25.57%
1 gen 1980 anni
23.162
+0.331
1.45%
1 gen 1981 anni
23.886
+0.723
3.12%
1 gen 1982 anni
31.37
+7.484
31.33%
1 gen 1983 anni
25.397
-5.973
-19.04%
1 gen 1984 anni
24.304
-1.093
-4.3%
1 gen 1985 anni
21.718
-2.586
-10.64%
1 gen 1986 anni
24.601
+2.882
13.27%
1 gen 1987 anni
17.91
-6.69
-27.2%
1 gen 1988 anni
17.164
-0.746
-4.17%
1 gen 1989 anni
17.029
-0.135
-0.79%
1 gen 1990 anni
16.197
-0.832
-4.88%
1 gen 1991 anni
15.054
-1.143
-7.06%
1 gen 1992 anni
16.129
+1.075
7.14%
1 gen 1993 anni
15.693
-0.436
-2.7%
1 gen 1994 anni
14.626
-1.068
-6.8%
1 gen 1995 anni
14.828
+0.202
1.38%
1 gen 1996 anni
13.487
-1.341
-9.04%
1 gen 1997 anni
0.0
-13.487
-100.0%
1 gen 2008 anni
1.135
+1.135
%
1 gen 2009 anni
1.133
-0.002
-0.16%
1 gen 2010 anni
1.014
-0.118
-10.43%
1 gen 2011 anni
0.938
-0.076
-7.51%
1 gen 2012 anni
3.868
+2.93
312.22%
1 gen 2013 anni
1.293
-2.575
-66.58%
1 gen 2014 anni
0.912
-0.38
-29.41%
Classificazione dei paesi secondo i statistiche attuali per anni


Commenti: