29
/it/
it
AIzaSyAYiBZKx7MnpbEhh9jyipgxe19OcubqV5w
April 1, 2024
52133
North America
NAC
false
2
1
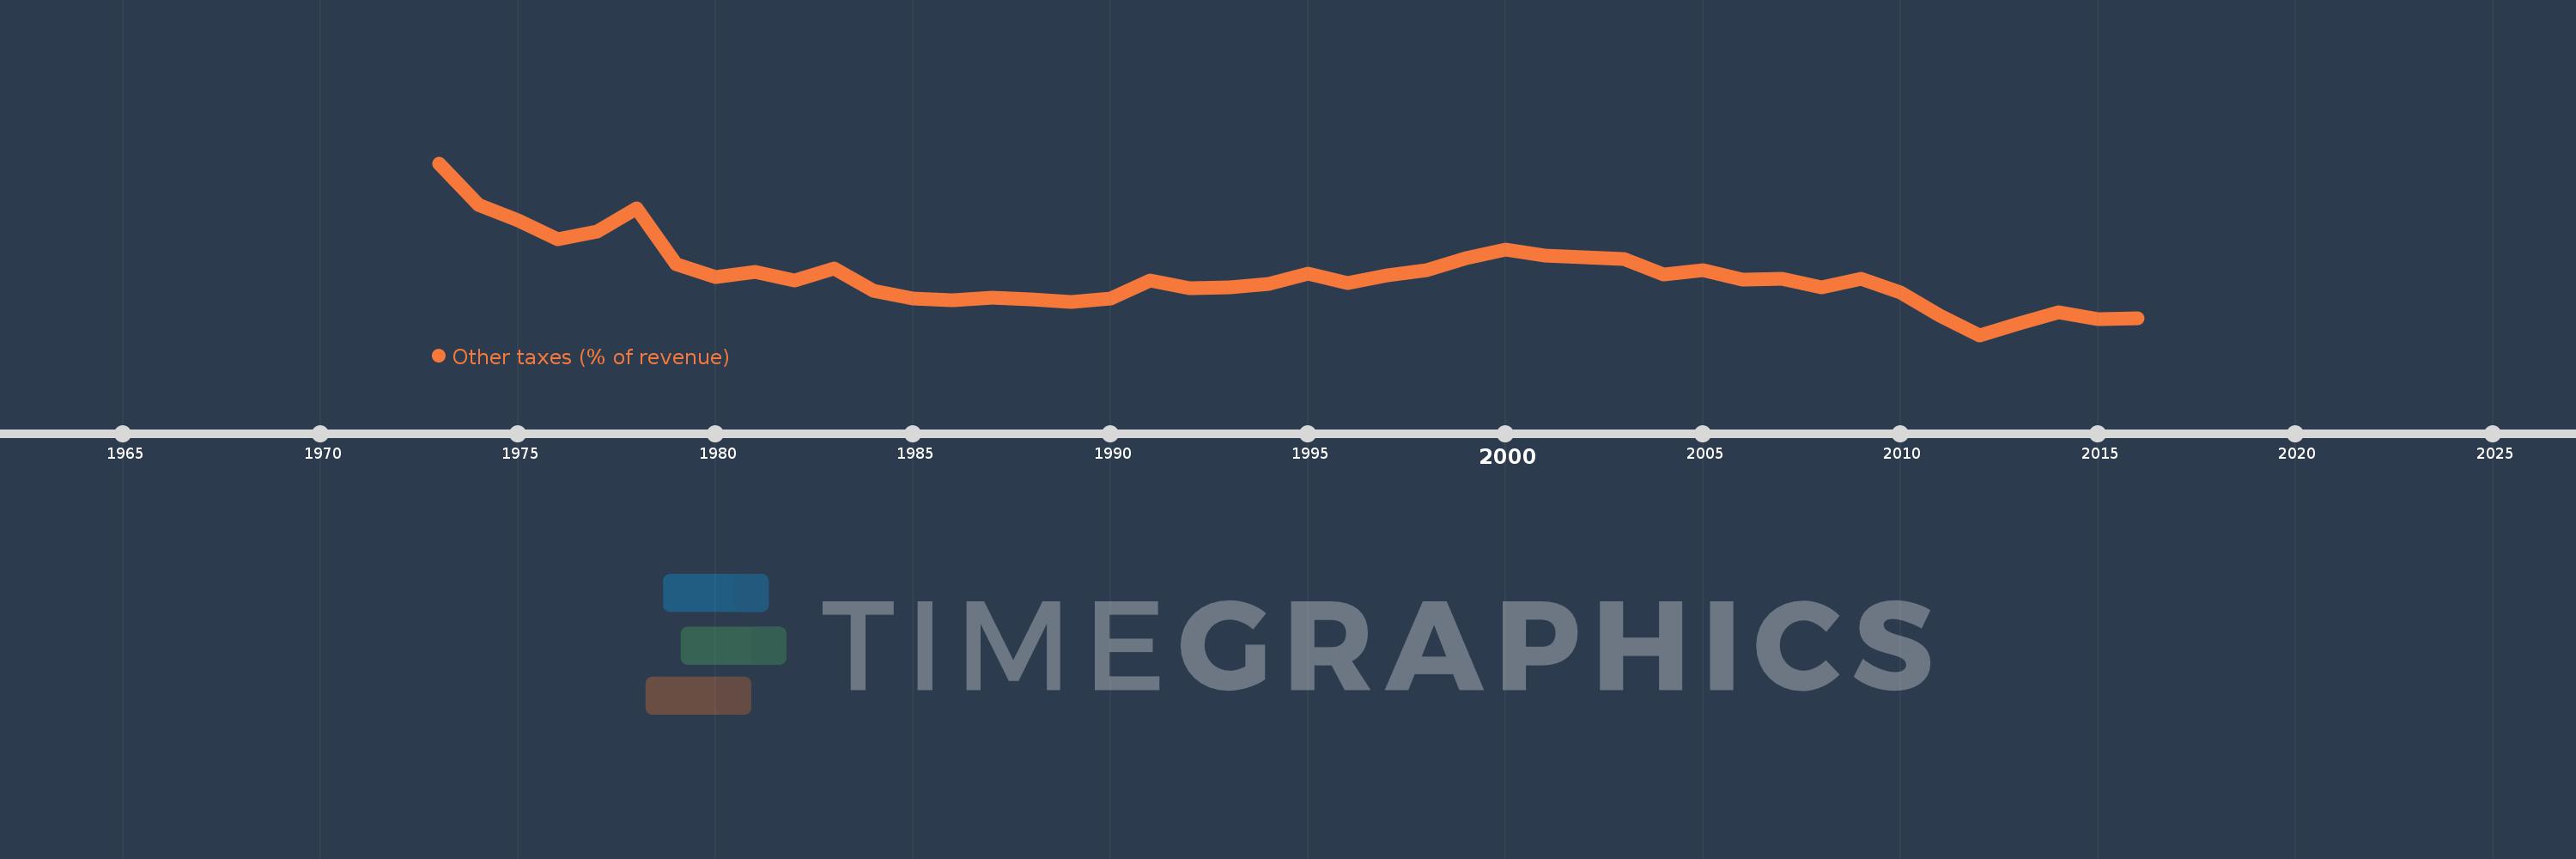
Other taxes (% of revenue)
2016,2015,2014,2013,2012,2011,2010,2009,2008,2007,2006,2005,2004,2003,2002,2001,2000,1999,1998,1997,1996,1995,1994,1993,1992,1991,1990,1989,1988,1987,1986,1985,1984,1983,1982,1981,1980,1979,1978,1977,1976,1975,1974,1973
Queste statistiche in altri paesi:
AfghanistanAlbaniaAlgeriaAngolaAntigua and BarbudaArab WorldArgentinaArmeniaAustraliaAustriaAzerbaijanBahamas, TheBahrainBangladeshBarbadosBelarusBelgiumBelizeBeninBhutanBoliviaBosnia and HerzegovinaBotswanaBrazilBulgariaBurkina FasoBurundiCabo VerdeCambodiaCaribbean small statesCentral African RepublicCentral Europe and the BalticsChileChinaColombiaCongo, Dem. Rep.Congo, Rep.Costa RicaCote d'IvoireCroatiaCyprusCzech RepublicDenmarkDominicaDominican RepublicEarly-demographic dividendEast Asia & PacificEast Asia & Pacific (excluding high income)East Asia & Pacific (IDA & IBRD countries)Egypt, Arab Rep.El SalvadorEquatorial GuineaEstoniaEthiopiaEuro areaEurope & Central AsiaEurope & Central Asia (excluding high income)Europe & Central Asia (IDA & IBRD countries)European UnionFijiFinlandFranceGambia, TheGeorgiaGermanyGreeceGrenadaGuatemalaHeavily indebted poor countries (HIPC)High incomeHondurasHong Kong SAR, ChinaHungaryIBRD onlyIcelandIDA & IBRD totalIDA blendIDA onlyIDA totalIndiaIndonesiaIran, Islamic Rep.IraqIrelandIsraelItalyJamaicaJapanJordanKazakhstanKenyaKiribatiKorea, Rep.KuwaitKyrgyz RepublicLao PDRLate-demographic dividendLatin America & Caribbean Latin America & Caribbean (excluding high income)Latin America & the Caribbean (IDA & IBRD countries)LatviaLeast developed countries: UN classificationLebanonLesothoLiberiaLithuaniaLow & middle incomeLow incomeLower middle incomeLuxembourgMacao SAR, ChinaMacedonia, FYRMadagascarMalawiMalaysiaMaldivesMaliMaltaMauritiusMexicoMicronesia, Fed. Sts.Middle East & North AfricaMiddle East & North Africa (excluding high income)Middle East & North Africa (IDA & IBRD countries)Middle incomeMoldovaMongoliaMoroccoMozambiqueNamibiaNepalNetherlandsNew ZealandNicaraguaNorth AmericaNorwayOECD membersOmanOther small statesPakistanPanamaPapua New GuineaParaguayPeruPhilippinesPolandPortugalPost-demographic dividendPre-demographic dividendRomaniaRussian FederationRwandaSamoaSan MarinoSao Tome and PrincipeSenegalSerbiaSeychellesSierra LeoneSingaporeSlovak RepublicSloveniaSmall statesSolomon IslandsSouth AfricaSouth AsiaSouth Asia (IDA & IBRD)SpainSri LankaSt. Kitts and NevisSt. LuciaSub-Saharan Africa Sub-Saharan Africa (excluding high income)Sub-Saharan Africa (IDA & IBRD countries)SurinameSwazilandSwedenSwitzerlandSyrian Arab RepublicTajikistanTanzaniaThailandTimor-LesteTogoTrinidad and TobagoTunisiaTurkeyUgandaUkraineUnited KingdomUnited StatesUpper middle incomeUruguayVanuatuVenezuela, RBVietnamWest Bank and GazaWorldYemen, Rep.ZambiaZimbabwe Linea del tempo:
Questa scala temporale mostra un grafico dal 1973 anno al 2016 anno. North America. I dati fino ad 1972 anno non disponibili. Il numero di osservazioni attuali secondo i date: 44.
La fonte (nome):
Indicatori dello sviluppo mondiale
La fonte (organizzazione):
International Monetary Fund, Government Finance Statistics Yearbook and data files.
Categorie:
Public Sector
sono stati aggiornati
23 apr 2017 anni
Indicatori delle variazioni dei valori per anni
Minima:
0.371
1 gen 2012 anni
Massimo:
2.548
1 gen 1973 anni
Alla data di osservazione
Valore
Variazione assoluta
La variazione rispetto al valore precedente
1 gen 1973 anni
2.548
+2.548
0.0%
1 gen 1974 anni
2.021
-0.527
-20.68%
1 gen 1975 anni
1.823
-0.198
-9.81%
1 gen 1976 anni
1.584
-0.238
-13.08%
1 gen 1977 anni
1.681
+0.097
6.13%
1 gen 1978 anni
1.977
+0.295
17.57%
1 gen 1979 anni
1.272
-0.704
-35.64%
1 gen 1980 anni
1.109
-0.163
-12.82%
1 gen 1981 anni
1.174
+0.065
5.86%
1 gen 1982 anni
1.063
-0.111
-9.49%
1 gen 1983 anni
1.213
+0.15
14.11%
1 gen 1984 anni
0.928
-0.285
-23.52%
1 gen 1985 anni
0.839
-0.088
-9.5%
1 gen 1986 anni
0.814
-0.026
-3.07%
1 gen 1987 anni
0.848
+0.034
4.22%
1 gen 1988 anni
0.825
-0.023
-2.67%
1 gen 1989 anni
0.791
-0.035
-4.22%
1 gen 1990 anni
0.838
+0.047
6.0%
1 gen 1991 anni
1.061
+0.223
26.63%
1 gen 1992 anni
0.966
-0.095
-8.99%
1 gen 1993 anni
0.97
+0.004
0.44%
1 gen 1994 anni
1.016
+0.046
4.78%
1 gen 1995 anni
1.145
+0.128
12.63%
1 gen 1996 anni
1.029
-0.116
-10.13%
1 gen 1997 anni
1.124
+0.095
9.21%
1 gen 1998 anni
1.192
+0.068
6.09%
1 gen 1999 anni
1.34
+0.148
12.42%
1 gen 2000 anni
1.458
+0.118
8.81%
1 gen 2001 anni
1.375
-0.083
-5.67%
1 gen 2002 anni
1.353
-0.022
-1.59%
1 gen 2003 anni
1.331
-0.023
-1.68%
1 gen 2004 anni
1.143
-0.188
-14.12%
1 gen 2005 anni
1.196
+0.053
4.64%
1 gen 2006 anni
1.069
-0.127
-10.62%
1 gen 2007 anni
1.081
+0.012
1.14%
1 gen 2008 anni
0.98
-0.101
-9.35%
1 gen 2009 anni
1.08
+0.1
10.22%
1 gen 2010 anni
0.909
-0.172
-15.89%
1 gen 2011 anni
0.611
-0.298
-32.78%
1 gen 2012 anni
0.371
-0.239
-39.19%
1 gen 2013 anni
0.517
+0.146
39.22%
1 gen 2014 anni
0.659
+0.142
27.46%
1 gen 2015 anni
0.567
-0.092
-13.96%
1 gen 2016 anni
0.581
+0.014
2.48%
Classificazione dei paesi secondo i statistiche attuali per anni


Commenti: