29
/it/
it
AIzaSyAYiBZKx7MnpbEhh9jyipgxe19OcubqV5w
April 1, 2024
30175
Euro area
EMU
false
2
1
Other taxes (% of revenue)
2015,2014,2013,2012,2011,2010,2009,2008,2007,2006,2005,2004,2003,2002,2001,2000,1999,1998,1997,1996,1995,1994,1993,1992,1991,1990,1989,1988,1987,1986,1985,1984,1983,1982,1981,1980,1979,1978,1977,1976,1975,1974
Queste statistiche in altri paesi:
AfghanistanAlbaniaAlgeriaAngolaAntigua and BarbudaArab WorldArgentinaArmeniaAustraliaAustriaAzerbaijanBahamas, TheBahrainBangladeshBarbadosBelarusBelgiumBelizeBeninBhutanBoliviaBosnia and HerzegovinaBotswanaBrazilBulgariaBurkina FasoBurundiCabo VerdeCambodiaCaribbean small statesCentral African RepublicCentral Europe and the BalticsChileChinaColombiaCongo, Dem. Rep.Congo, Rep.Costa RicaCote d'IvoireCroatiaCyprusCzech RepublicDenmarkDominicaDominican RepublicEarly-demographic dividendEast Asia & PacificEast Asia & Pacific (excluding high income)East Asia & Pacific (IDA & IBRD countries)Egypt, Arab Rep.El SalvadorEquatorial GuineaEstoniaEthiopiaEuro areaEurope & Central AsiaEurope & Central Asia (excluding high income)Europe & Central Asia (IDA & IBRD countries)European UnionFijiFinlandFranceGambia, TheGeorgiaGermanyGreeceGrenadaGuatemalaHeavily indebted poor countries (HIPC)High incomeHondurasHong Kong SAR, ChinaHungaryIBRD onlyIcelandIDA & IBRD totalIDA blendIDA onlyIDA totalIndiaIndonesiaIran, Islamic Rep.IraqIrelandIsraelItalyJamaicaJapanJordanKazakhstanKenyaKiribatiKorea, Rep.KuwaitKyrgyz RepublicLao PDRLate-demographic dividendLatin America & Caribbean Latin America & Caribbean (excluding high income)Latin America & the Caribbean (IDA & IBRD countries)LatviaLeast developed countries: UN classificationLebanonLesothoLiberiaLithuaniaLow & middle incomeLow incomeLower middle incomeLuxembourgMacao SAR, ChinaMacedonia, FYRMadagascarMalawiMalaysiaMaldivesMaliMaltaMauritiusMexicoMicronesia, Fed. Sts.Middle East & North AfricaMiddle East & North Africa (excluding high income)Middle East & North Africa (IDA & IBRD countries)Middle incomeMoldovaMongoliaMoroccoMozambiqueNamibiaNepalNetherlandsNew ZealandNicaraguaNorth AmericaNorwayOECD membersOmanOther small statesPakistanPanamaPapua New GuineaParaguayPeruPhilippinesPolandPortugalPost-demographic dividendPre-demographic dividendRomaniaRussian FederationRwandaSamoaSan MarinoSao Tome and PrincipeSenegalSerbiaSeychellesSierra LeoneSingaporeSlovak RepublicSloveniaSmall statesSolomon IslandsSouth AfricaSouth AsiaSouth Asia (IDA & IBRD)SpainSri LankaSt. Kitts and NevisSt. LuciaSub-Saharan Africa Sub-Saharan Africa (excluding high income)Sub-Saharan Africa (IDA & IBRD countries)SurinameSwazilandSwedenSwitzerlandSyrian Arab RepublicTajikistanTanzaniaThailandTimor-LesteTogoTrinidad and TobagoTunisiaTurkeyUgandaUkraineUnited KingdomUnited StatesUpper middle incomeUruguayVanuatuVenezuela, RBVietnamWest Bank and GazaWorldYemen, Rep.ZambiaZimbabwe Linea del tempo:
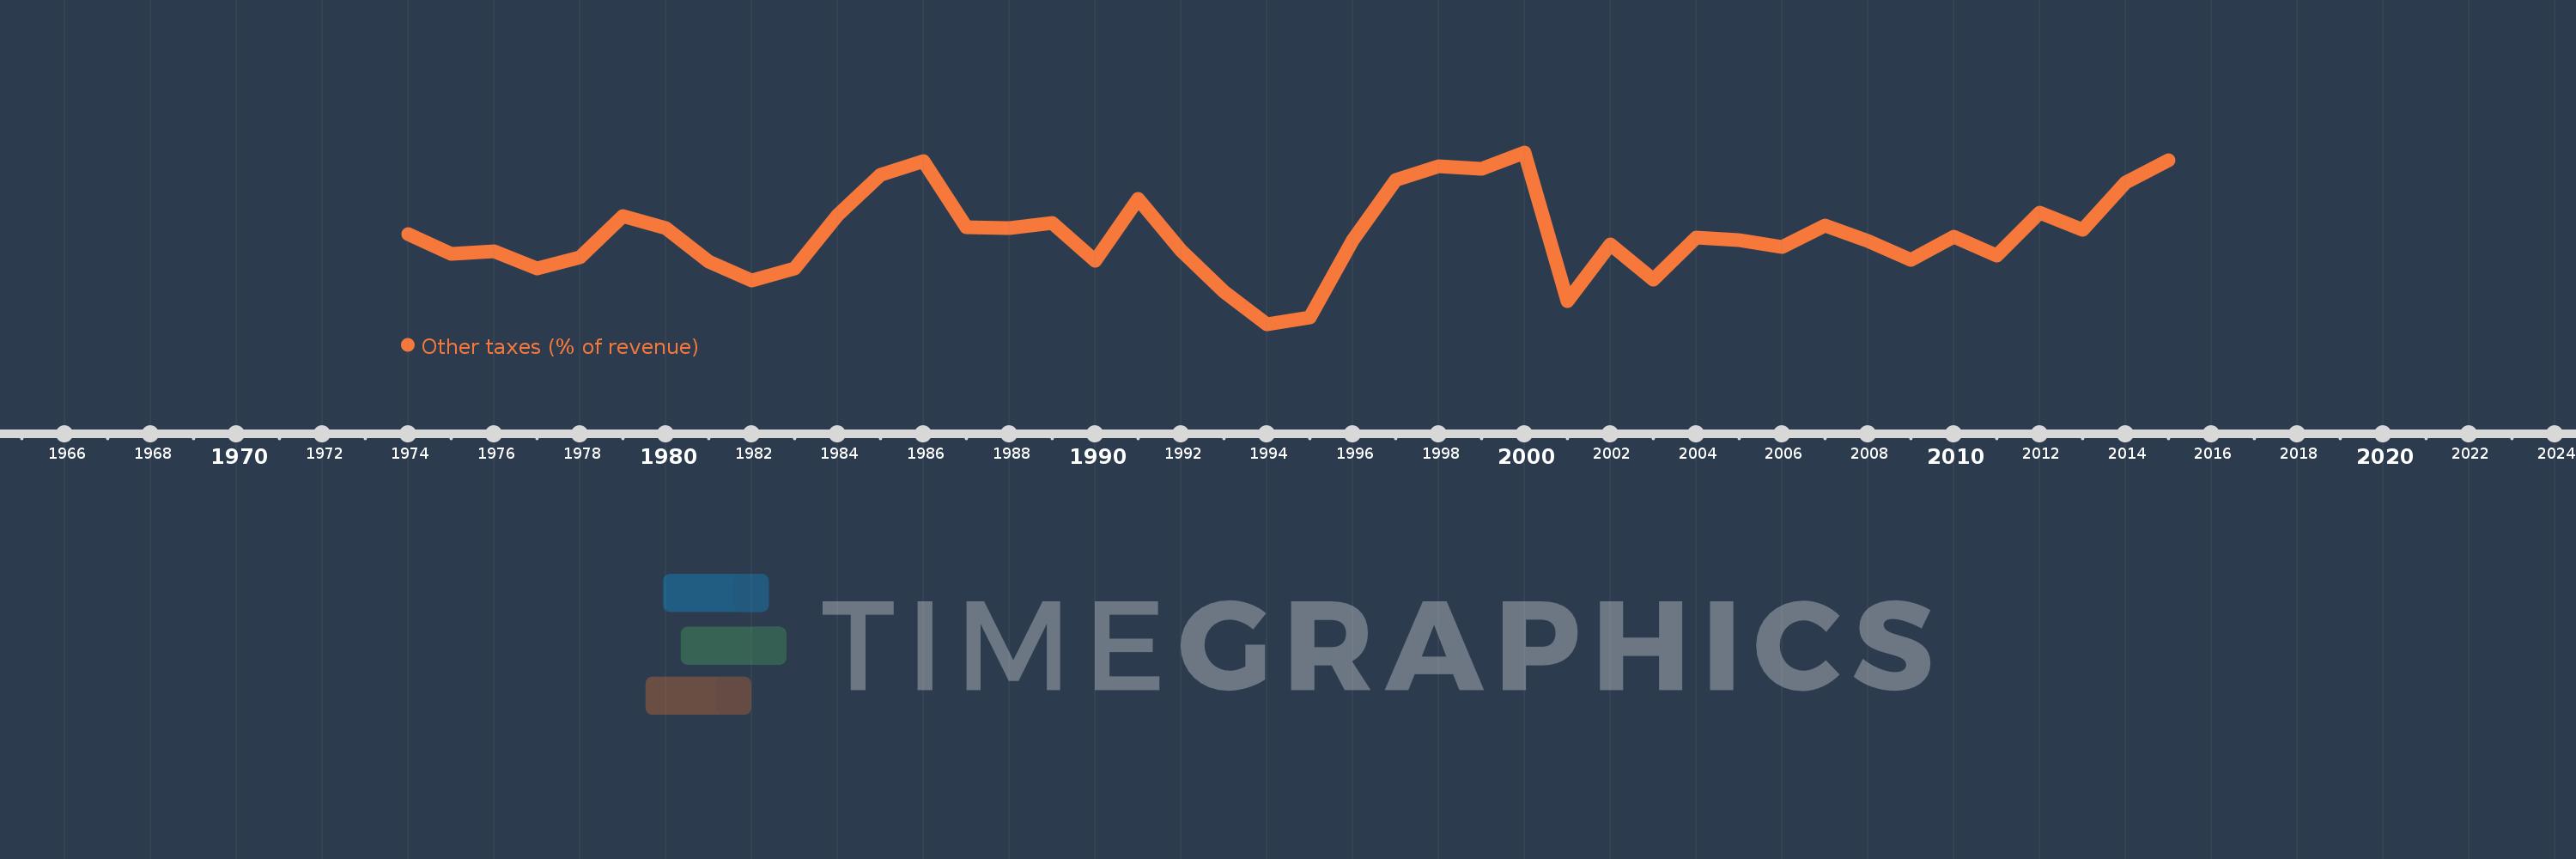
Questa scala temporale mostra un grafico dal 1974 anno al 2015 anno. Euro area. I dati fino ad 1973 anno non disponibili. Il numero di osservazioni attuali secondo i date: 42.
La fonte (nome):
Indicatori dello sviluppo mondiale
La fonte (organizzazione):
International Monetary Fund, Government Finance Statistics Yearbook and data files.
Categorie:
Public Sector
sono stati aggiornati
23 apr 2017 anni
Indicatori delle variazioni dei valori per anni
Minima:
0.95
1 gen 1994 anni
Massimo:
2.718
1 gen 2000 anni
Alla data di osservazione
Valore
Variazione assoluta
La variazione rispetto al valore precedente
1 gen 1974 anni
1.875
+1.875
0.0%
1 gen 1975 anni
1.674
-0.201
-10.72%
1 gen 1976 anni
1.7
+0.027
1.6%
1 gen 1977 anni
1.527
-0.174
-10.21%
1 gen 1978 anni
1.641
+0.114
7.48%
1 gen 1979 anni
2.066
+0.426
25.93%
1 gen 1980 anni
1.943
-0.123
-5.96%
1 gen 1981 anni
1.596
-0.347
-17.86%
1 gen 1982 anni
1.404
-0.193
-12.07%
1 gen 1983 anni
1.528
+0.124
8.84%
1 gen 1984 anni
2.069
+0.541
35.41%
1 gen 1985 anni
2.485
+0.416
20.12%
1 gen 1986 anni
2.633
+0.148
5.95%
1 gen 1987 anni
1.947
-0.686
-26.05%
1 gen 1988 anni
1.939
-0.008
-0.4%
1 gen 1989 anni
1.988
+0.049
2.54%
1 gen 1990 anni
1.603
-0.385
-19.35%
1 gen 1991 anni
2.242
+0.639
39.84%
1 gen 1992 anni
1.711
-0.531
-23.67%
1 gen 1993 anni
1.281
-0.431
-25.17%
1 gen 1994 anni
0.95
-0.331
-25.85%
1 gen 1995 anni
1.022
+0.073
7.65%
1 gen 1996 anni
1.814
+0.792
77.49%
1 gen 1997 anni
2.433
+0.618
34.09%
1 gen 1998 anni
2.574
+0.141
5.8%
1 gen 1999 anni
2.549
-0.024
-0.94%
1 gen 2000 anni
2.718
+0.168
6.61%
1 gen 2001 anni
1.187
-1.531
-56.32%
1 gen 2002 anni
1.769
+0.582
49.01%
1 gen 2003 anni
1.407
-0.363
-20.49%
1 gen 2004 anni
1.844
+0.437
31.08%
1 gen 2005 anni
1.813
-0.031
-1.68%
1 gen 2006 anni
1.742
-0.07
-3.88%
1 gen 2007 anni
1.964
+0.222
12.74%
1 gen 2008 anni
1.808
-0.157
-7.97%
1 gen 2009 anni
1.616
-0.192
-10.6%
1 gen 2010 anni
1.853
+0.237
14.66%
1 gen 2011 anni
1.66
-0.193
-10.43%
1 gen 2012 anni
2.098
+0.439
26.43%
1 gen 2013 anni
1.923
-0.175
-8.35%
1 gen 2014 anni
2.409
+0.486
25.25%
1 gen 2015 anni
2.64
+0.231
9.6%
Classificazione dei paesi secondo i statistiche attuali per anni


Commenti: