29
/it/
it
AIzaSyAYiBZKx7MnpbEhh9jyipgxe19OcubqV5w
April 1, 2024
33741
European Union
EUU
false
2
1
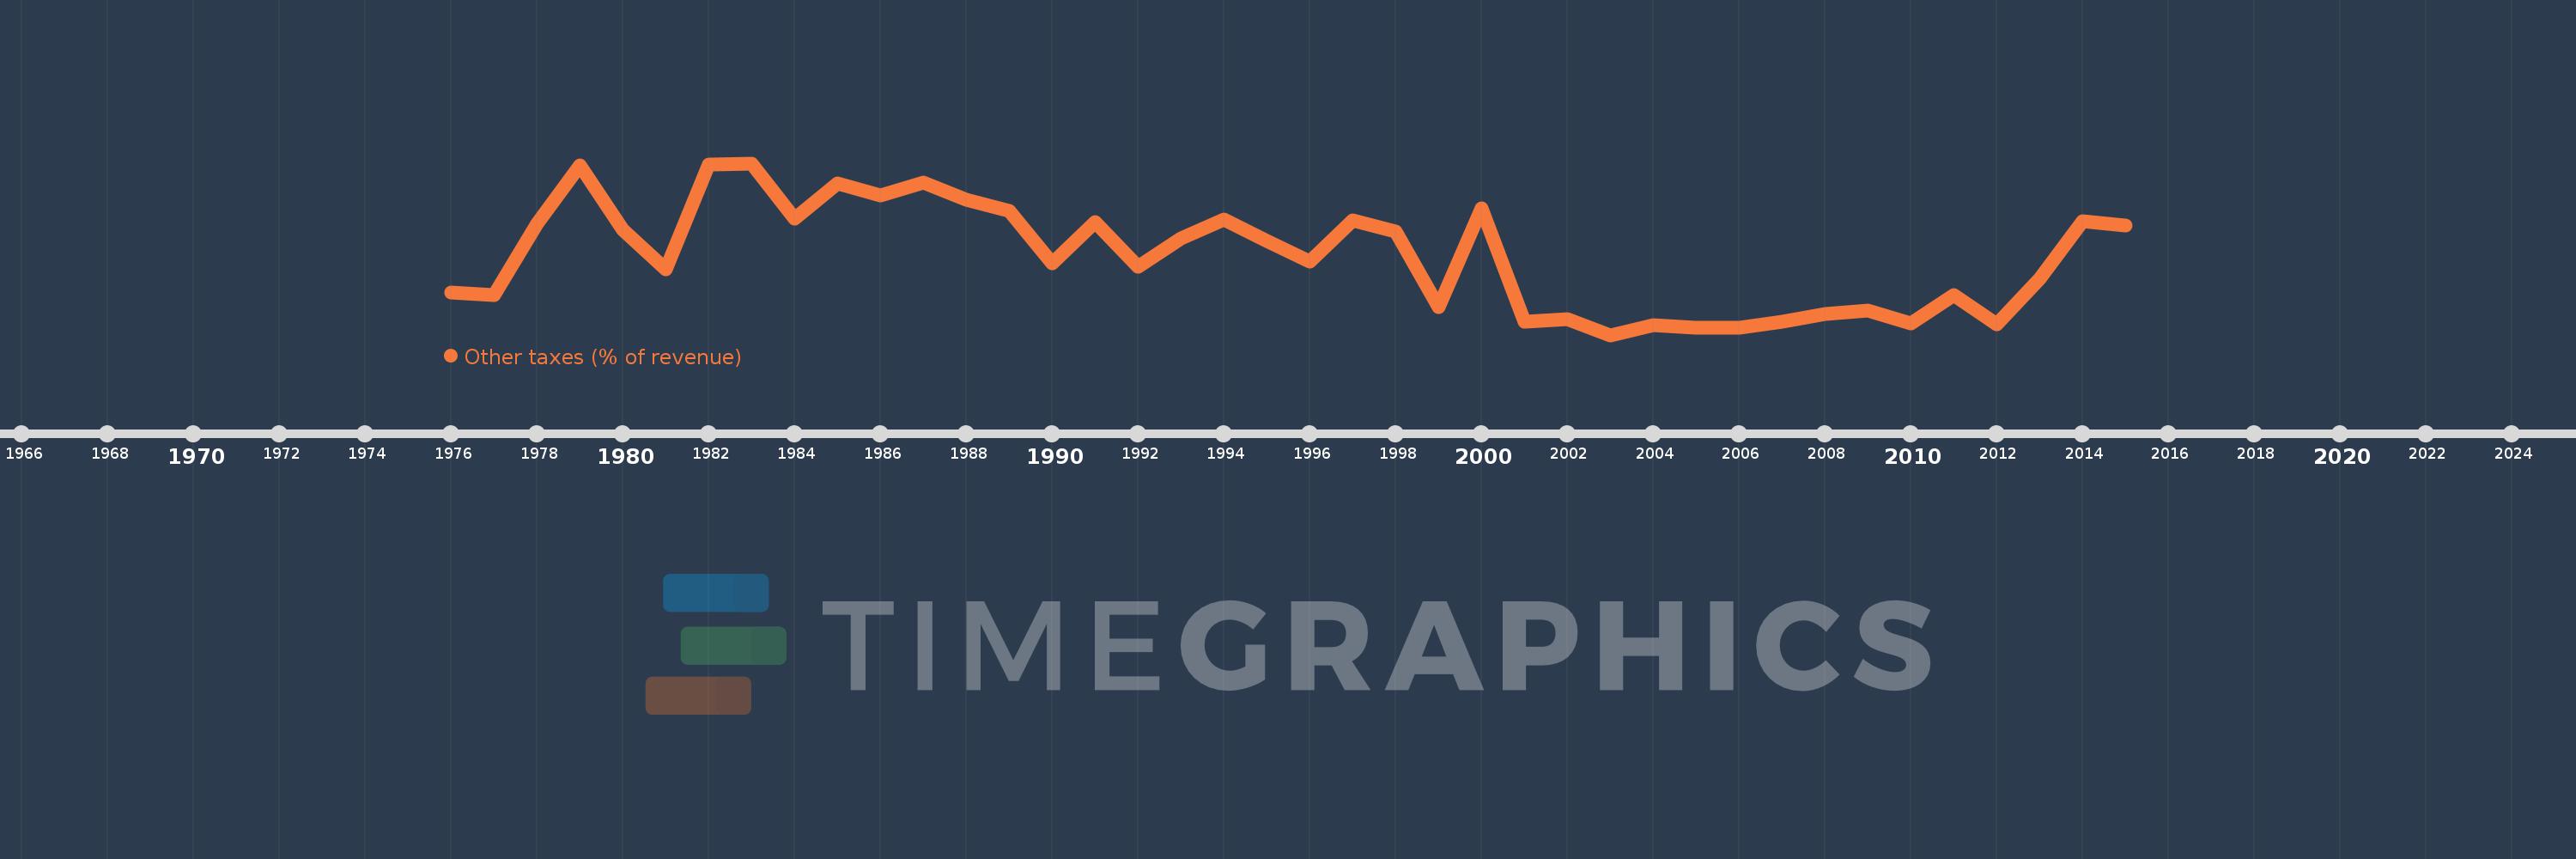
Other taxes (% of revenue)
2015,2014,2013,2012,2011,2010,2009,2008,2007,2006,2005,2004,2003,2002,2001,2000,1999,1998,1997,1996,1995,1994,1993,1992,1991,1990,1989,1988,1987,1986,1985,1984,1983,1982,1981,1980,1979,1978,1977,1976
Queste statistiche in altri paesi:
AfghanistanAlbaniaAlgeriaAngolaAntigua and BarbudaArab WorldArgentinaArmeniaAustraliaAustriaAzerbaijanBahamas, TheBahrainBangladeshBarbadosBelarusBelgiumBelizeBeninBhutanBoliviaBosnia and HerzegovinaBotswanaBrazilBulgariaBurkina FasoBurundiCabo VerdeCambodiaCaribbean small statesCentral African RepublicCentral Europe and the BalticsChileChinaColombiaCongo, Dem. Rep.Congo, Rep.Costa RicaCote d'IvoireCroatiaCyprusCzech RepublicDenmarkDominicaDominican RepublicEarly-demographic dividendEast Asia & PacificEast Asia & Pacific (excluding high income)East Asia & Pacific (IDA & IBRD countries)Egypt, Arab Rep.El SalvadorEquatorial GuineaEstoniaEthiopiaEuro areaEurope & Central AsiaEurope & Central Asia (excluding high income)Europe & Central Asia (IDA & IBRD countries)European UnionFijiFinlandFranceGambia, TheGeorgiaGermanyGreeceGrenadaGuatemalaHeavily indebted poor countries (HIPC)High incomeHondurasHong Kong SAR, ChinaHungaryIBRD onlyIcelandIDA & IBRD totalIDA blendIDA onlyIDA totalIndiaIndonesiaIran, Islamic Rep.IraqIrelandIsraelItalyJamaicaJapanJordanKazakhstanKenyaKiribatiKorea, Rep.KuwaitKyrgyz RepublicLao PDRLate-demographic dividendLatin America & Caribbean Latin America & Caribbean (excluding high income)Latin America & the Caribbean (IDA & IBRD countries)LatviaLeast developed countries: UN classificationLebanonLesothoLiberiaLithuaniaLow & middle incomeLow incomeLower middle incomeLuxembourgMacao SAR, ChinaMacedonia, FYRMadagascarMalawiMalaysiaMaldivesMaliMaltaMauritiusMexicoMicronesia, Fed. Sts.Middle East & North AfricaMiddle East & North Africa (excluding high income)Middle East & North Africa (IDA & IBRD countries)Middle incomeMoldovaMongoliaMoroccoMozambiqueNamibiaNepalNetherlandsNew ZealandNicaraguaNorth AmericaNorwayOECD membersOmanOther small statesPakistanPanamaPapua New GuineaParaguayPeruPhilippinesPolandPortugalPost-demographic dividendPre-demographic dividendRomaniaRussian FederationRwandaSamoaSan MarinoSao Tome and PrincipeSenegalSerbiaSeychellesSierra LeoneSingaporeSlovak RepublicSloveniaSmall statesSolomon IslandsSouth AfricaSouth AsiaSouth Asia (IDA & IBRD)SpainSri LankaSt. Kitts and NevisSt. LuciaSub-Saharan Africa Sub-Saharan Africa (excluding high income)Sub-Saharan Africa (IDA & IBRD countries)SurinameSwazilandSwedenSwitzerlandSyrian Arab RepublicTajikistanTanzaniaThailandTimor-LesteTogoTrinidad and TobagoTunisiaTurkeyUgandaUkraineUnited KingdomUnited StatesUpper middle incomeUruguayVanuatuVenezuela, RBVietnamWest Bank and GazaWorldYemen, Rep.ZambiaZimbabwe Linea del tempo:
Questa scala temporale mostra un grafico dal 1976 anno al 2015 anno. European Union. I dati fino ad 1975 anno non disponibili. Il numero di osservazioni attuali secondo i date: 40.
La fonte (nome):
Indicatori dello sviluppo mondiale
La fonte (organizzazione):
International Monetary Fund, Government Finance Statistics Yearbook and data files.
Categorie:
Public Sector
sono stati aggiornati
23 apr 2017 anni
Indicatori delle variazioni dei valori per anni
Minima:
0.861
1 gen 2003 anni
Massimo:
3.083
1 gen 1983 anni
Alla data di osservazione
Valore
Variazione assoluta
La variazione rispetto al valore precedente
1 gen 1976 anni
1.406
+1.406
0.0%
1 gen 1977 anni
1.381
-0.025
-1.8%
1 gen 1978 anni
2.305
+0.925
66.95%
1 gen 1979 anni
3.053
+0.748
32.44%
1 gen 1980 anni
2.223
-0.83
-27.2%
1 gen 1981 anni
1.711
-0.512
-23.02%
1 gen 1982 anni
3.063
+1.352
79.04%
1 gen 1983 anni
3.083
+0.019
0.63%
1 gen 1984 anni
2.368
-0.715
-23.2%
1 gen 1985 anni
2.824
+0.457
19.29%
1 gen 1986 anni
2.662
-0.162
-5.73%
1 gen 1987 anni
2.837
+0.174
6.55%
1 gen 1988 anni
2.614
-0.223
-7.86%
1 gen 1989 anni
2.469
-0.145
-5.56%
1 gen 1990 anni
1.789
-0.68
-27.53%
1 gen 1991 anni
2.327
+0.538
30.07%
1 gen 1992 anni
1.746
-0.581
-24.96%
1 gen 1993 anni
2.111
+0.365
20.89%
1 gen 1994 anni
2.356
+0.245
11.62%
1 gen 1995 anni
2.081
-0.275
-11.68%
1 gen 1996 anni
1.814
-0.267
-12.83%
1 gen 1997 anni
2.346
+0.531
29.29%
1 gen 1998 anni
2.202
-0.144
-6.14%
1 gen 1999 anni
1.217
-0.985
-44.73%
1 gen 2000 anni
2.496
+1.279
105.13%
1 gen 2001 anni
1.028
-1.468
-58.81%
1 gen 2002 anni
1.07
+0.041
4.03%
1 gen 2003 anni
0.861
-0.209
-19.52%
1 gen 2004 anni
0.993
+0.132
15.37%
1 gen 2005 anni
0.957
-0.036
-3.59%
1 gen 2006 anni
0.958
+0.001
0.08%
1 gen 2007 anni
1.037
+0.079
8.24%
1 gen 2008 anni
1.135
+0.098
9.46%
1 gen 2009 anni
1.182
+0.047
4.1%
1 gen 2010 anni
1.008
-0.174
-14.69%
1 gen 2011 anni
1.373
+0.365
36.24%
1 gen 2012 anni
0.997
-0.376
-27.39%
1 gen 2013 anni
1.589
+0.592
59.33%
1 gen 2014 anni
2.329
+0.74
46.6%
1 gen 2015 anni
2.273
-0.056
-2.42%
Classificazione dei paesi secondo i statistiche attuali per anni


Commenti: