29
/it/
it
AIzaSyAYiBZKx7MnpbEhh9jyipgxe19OcubqV5w
April 1, 2024
157726
Iran, Islamic Rep.
IRN
true
2
1
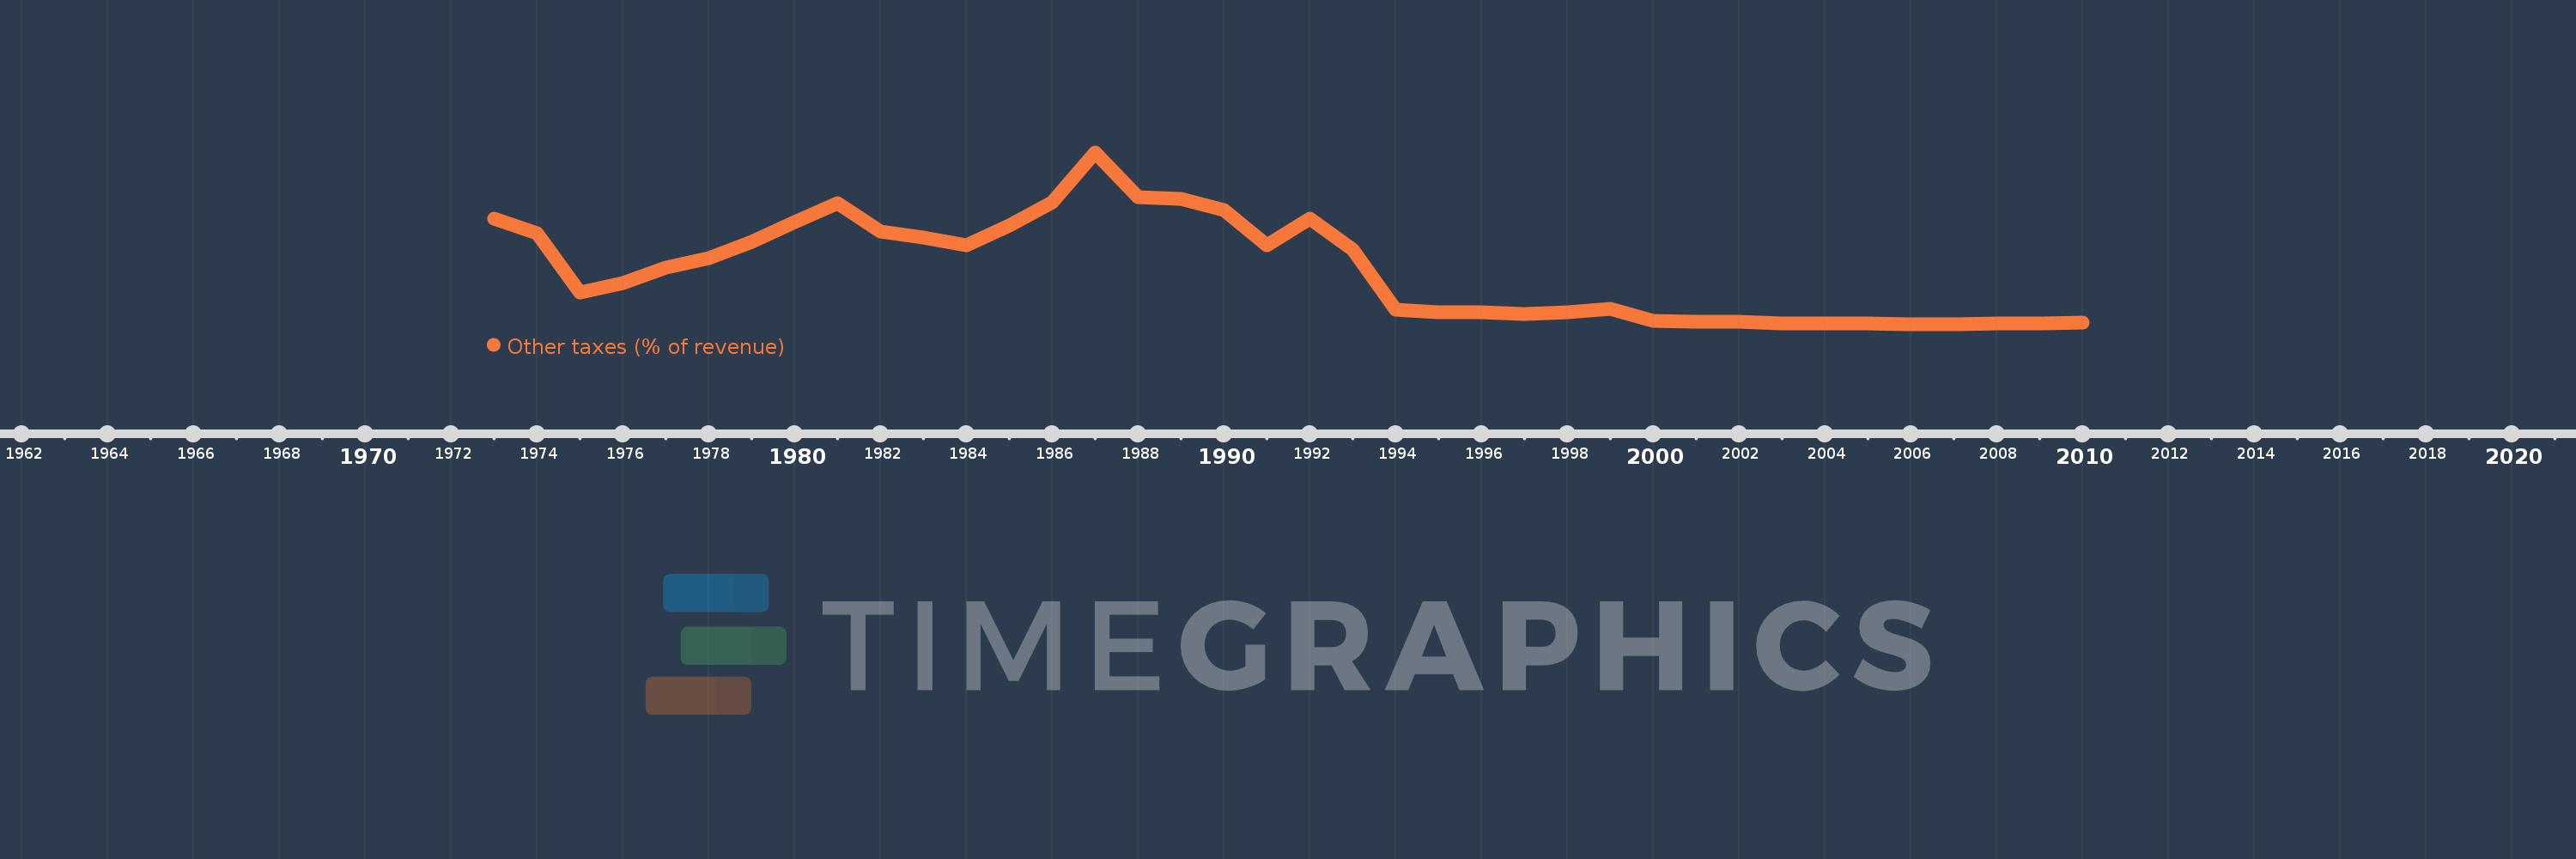
Other taxes (% of revenue)
2010,2009,2008,2007,2006,2005,2004,2003,2002,2001,2000,1999,1998,1997,1996,1995,1994,1993,1992,1991,1990,1989,1988,1987,1986,1985,1984,1983,1982,1981,1980,1979,1978,1977,1976,1975,1974,1973
Queste statistiche in altri paesi:
AfghanistanAlbaniaAlgeriaAngolaAntigua and BarbudaArab WorldArgentinaArmeniaAustraliaAustriaAzerbaijanBahamas, TheBahrainBangladeshBarbadosBelarusBelgiumBelizeBeninBhutanBoliviaBosnia and HerzegovinaBotswanaBrazilBulgariaBurkina FasoBurundiCabo VerdeCambodiaCaribbean small statesCentral African RepublicCentral Europe and the BalticsChileChinaColombiaCongo, Dem. Rep.Congo, Rep.Costa RicaCote d'IvoireCroatiaCyprusCzech RepublicDenmarkDominicaDominican RepublicEarly-demographic dividendEast Asia & PacificEast Asia & Pacific (excluding high income)East Asia & Pacific (IDA & IBRD countries)Egypt, Arab Rep.El SalvadorEquatorial GuineaEstoniaEthiopiaEuro areaEurope & Central AsiaEurope & Central Asia (excluding high income)Europe & Central Asia (IDA & IBRD countries)European UnionFijiFinlandFranceGambia, TheGeorgiaGermanyGreeceGrenadaGuatemalaHeavily indebted poor countries (HIPC)High incomeHondurasHong Kong SAR, ChinaHungaryIBRD onlyIcelandIDA & IBRD totalIDA blendIDA onlyIDA totalIndiaIndonesiaIran, Islamic Rep.IraqIrelandIsraelItalyJamaicaJapanJordanKazakhstanKenyaKiribatiKorea, Rep.KuwaitKyrgyz RepublicLao PDRLate-demographic dividendLatin America & Caribbean Latin America & Caribbean (excluding high income)Latin America & the Caribbean (IDA & IBRD countries)LatviaLeast developed countries: UN classificationLebanonLesothoLiberiaLithuaniaLow & middle incomeLow incomeLower middle incomeLuxembourgMacao SAR, ChinaMacedonia, FYRMadagascarMalawiMalaysiaMaldivesMaliMaltaMauritiusMexicoMicronesia, Fed. Sts.Middle East & North AfricaMiddle East & North Africa (excluding high income)Middle East & North Africa (IDA & IBRD countries)Middle incomeMoldovaMongoliaMoroccoMozambiqueNamibiaNepalNetherlandsNew ZealandNicaraguaNorth AmericaNorwayOECD membersOmanOther small statesPakistanPanamaPapua New GuineaParaguayPeruPhilippinesPolandPortugalPost-demographic dividendPre-demographic dividendRomaniaRussian FederationRwandaSamoaSan MarinoSao Tome and PrincipeSenegalSerbiaSeychellesSierra LeoneSingaporeSlovak RepublicSloveniaSmall statesSolomon IslandsSouth AfricaSouth AsiaSouth Asia (IDA & IBRD)SpainSri LankaSt. Kitts and NevisSt. LuciaSub-Saharan Africa Sub-Saharan Africa (excluding high income)Sub-Saharan Africa (IDA & IBRD countries)SurinameSwazilandSwedenSwitzerlandSyrian Arab RepublicTajikistanTanzaniaThailandTimor-LesteTogoTrinidad and TobagoTunisiaTurkeyUgandaUkraineUnited KingdomUnited StatesUpper middle incomeUruguayVanuatuVenezuela, RBVietnamWest Bank and GazaWorldYemen, Rep.ZambiaZimbabwe Linea del tempo:
Questa scala temporale mostra un grafico dal 1973 anno al 2010 anno. Iran, Islamic Rep.. I dati fino ad 1972 anno non disponibili. Il numero di osservazioni attuali secondo i date: 38.
La fonte (nome):
Indicatori dello sviluppo mondiale
La fonte (organizzazione):
International Monetary Fund, Government Finance Statistics Yearbook and data files.
Categorie:
Public Sector
sono stati aggiornati
23 apr 2017 anni
Indicatori delle variazioni dei valori per anni
Minima:
0.059
1 gen 2006 anni
Massimo:
6.861
1 gen 1987 anni
Alla data di osservazione
Valore
Variazione assoluta
La variazione rispetto al valore precedente
1 gen 1973 anni
4.255
+4.255
0.0%
1 gen 1974 anni
3.673
-0.581
-13.66%
1 gen 1975 anni
1.317
-2.356
-64.14%
1 gen 1976 anni
1.69
+0.373
28.32%
1 gen 1977 anni
2.284
+0.594
35.12%
1 gen 1978 anni
2.668
+0.384
16.79%
1 gen 1979 anni
3.322
+0.654
24.52%
1 gen 1980 anni
4.089
+0.767
23.09%
1 gen 1981 anni
4.839
+0.75
18.35%
1 gen 1982 anni
3.73
-1.11
-22.93%
1 gen 1983 anni
3.498
-0.231
-6.19%
1 gen 1984 anni
3.193
-0.305
-8.72%
1 gen 1985 anni
3.951
+0.758
23.74%
1 gen 1986 anni
4.886
+0.934
23.65%
1 gen 1987 anni
6.861
+1.975
40.43%
1 gen 1988 anni
5.089
-1.772
-25.82%
1 gen 1989 anni
5.008
-0.082
-1.6%
1 gen 1990 anni
4.569
-0.438
-8.75%
1 gen 1991 anni
3.183
-1.386
-30.34%
1 gen 1992 anni
4.25
+1.067
33.52%
1 gen 1993 anni
3.03
-1.219
-28.69%
1 gen 1994 anni
0.62
-2.41
-79.53%
1 gen 1995 anni
0.533
-0.087
-14.04%
1 gen 1996 anni
0.534
+0.001
0.27%
1 gen 1997 anni
0.471
-0.063
-11.84%
1 gen 1998 anni
0.529
+0.058
12.21%
1 gen 1999 anni
0.681
+0.152
28.77%
1 gen 2000 anni
0.201
-0.48
-70.47%
1 gen 2001 anni
0.168
-0.033
-16.42%
1 gen 2002 anni
0.168
0.0
-0.14%
1 gen 2003 anni
0.102
-0.066
-39.24%
1 gen 2004 anni
0.076
-0.026
-25.29%
1 gen 2005 anni
0.082
+0.006
7.67%
1 gen 2006 anni
0.059
-0.023
-27.92%
1 gen 2007 anni
0.066
+0.007
11.65%
1 gen 2008 anni
0.089
+0.023
34.48%
1 gen 2009 anni
0.095
+0.006
6.91%
1 gen 2010 anni
0.133
+0.038
40.14%
Classificazione dei paesi secondo i statistiche attuali per anni


Commenti: