29
/it/
it
AIzaSyAYiBZKx7MnpbEhh9jyipgxe19OcubqV5w
April 1, 2024
189392
Maldives
MDV
true
2
1
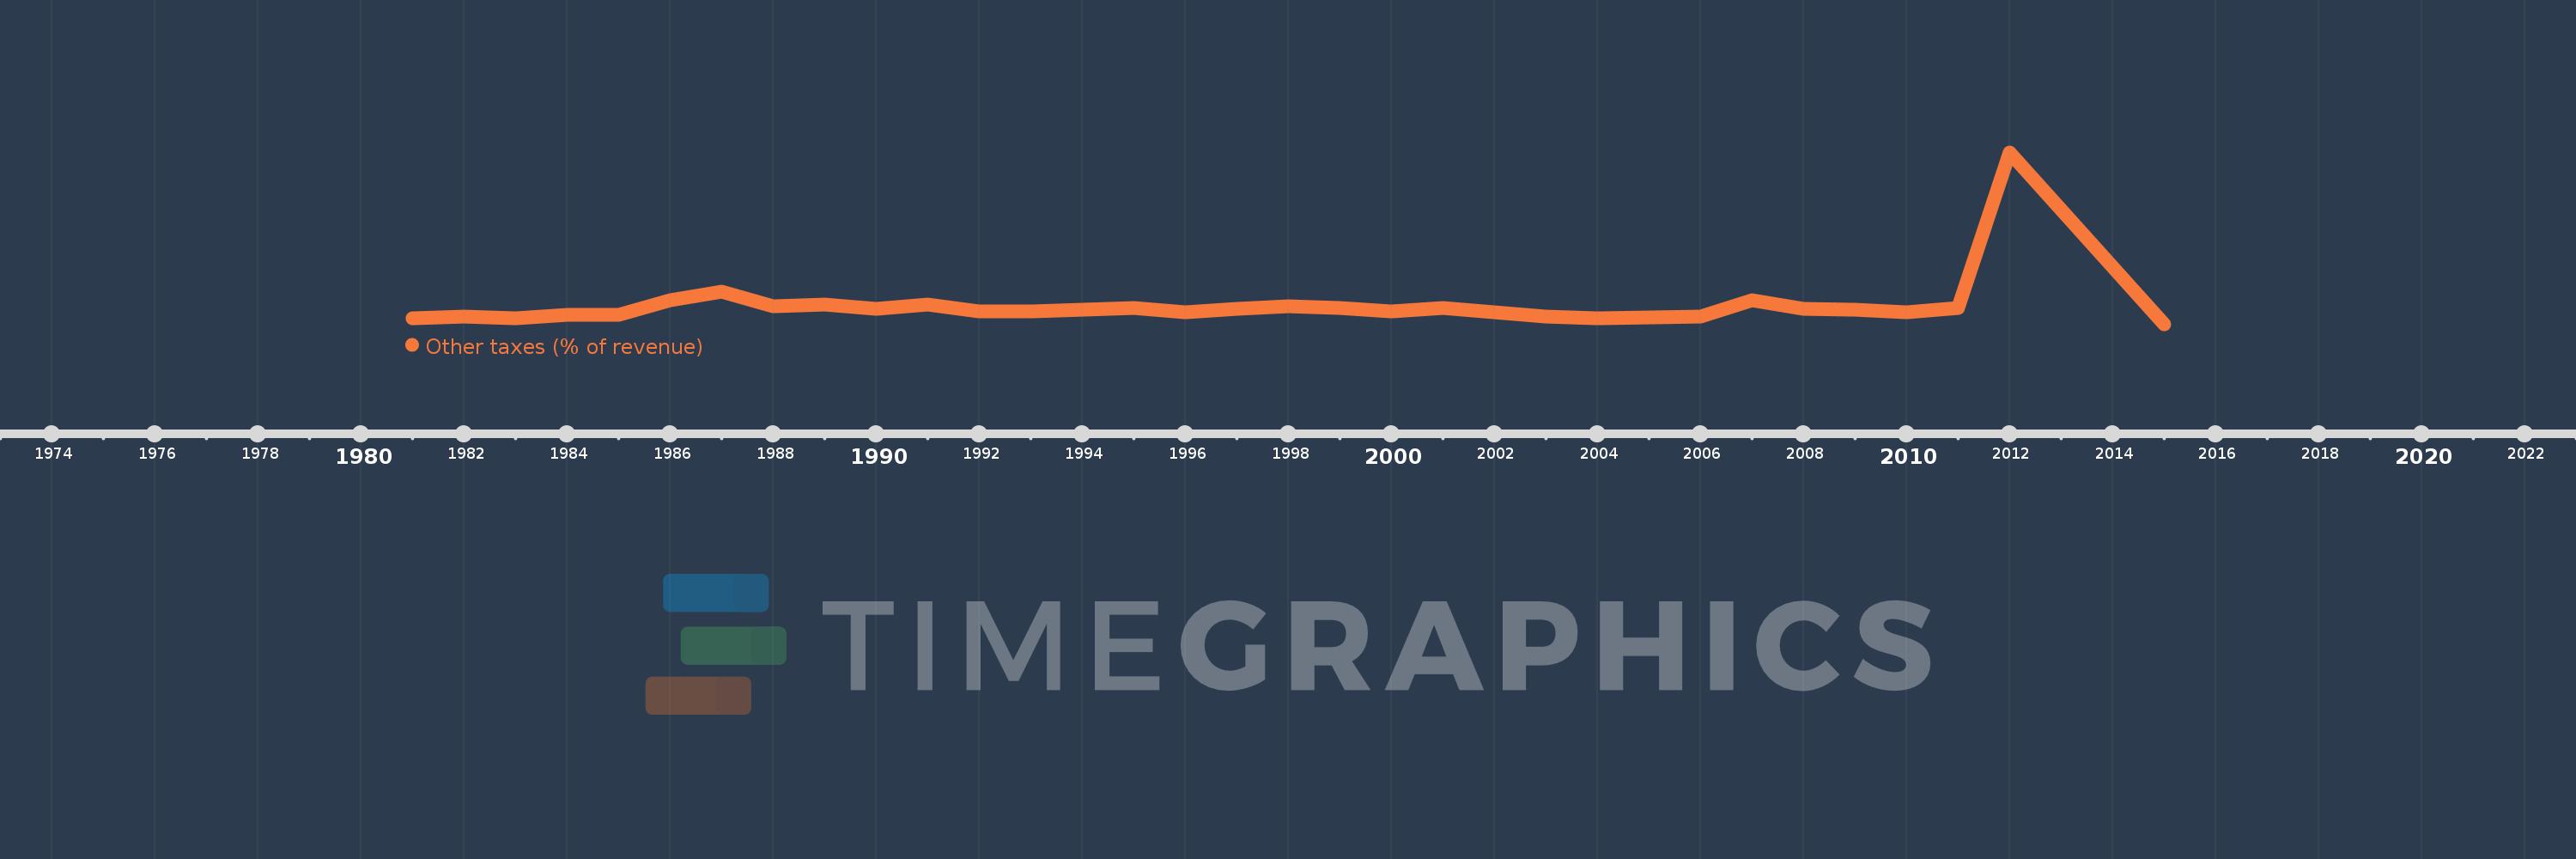
Other taxes (% of revenue)
2015,2012,2011,2010,2009,2008,2007,2006,2005,2004,2003,2002,2001,2000,1999,1998,1997,1996,1995,1994,1993,1992,1991,1990,1989,1988,1987,1986,1985,1984,1983,1982,1981
Queste statistiche in altri paesi:
AfghanistanAlbaniaAlgeriaAngolaAntigua and BarbudaArab WorldArgentinaArmeniaAustraliaAustriaAzerbaijanBahamas, TheBahrainBangladeshBarbadosBelarusBelgiumBelizeBeninBhutanBoliviaBosnia and HerzegovinaBotswanaBrazilBulgariaBurkina FasoBurundiCabo VerdeCambodiaCaribbean small statesCentral African RepublicCentral Europe and the BalticsChileChinaColombiaCongo, Dem. Rep.Congo, Rep.Costa RicaCote d'IvoireCroatiaCyprusCzech RepublicDenmarkDominicaDominican RepublicEarly-demographic dividendEast Asia & PacificEast Asia & Pacific (excluding high income)East Asia & Pacific (IDA & IBRD countries)Egypt, Arab Rep.El SalvadorEquatorial GuineaEstoniaEthiopiaEuro areaEurope & Central AsiaEurope & Central Asia (excluding high income)Europe & Central Asia (IDA & IBRD countries)European UnionFijiFinlandFranceGambia, TheGeorgiaGermanyGreeceGrenadaGuatemalaHeavily indebted poor countries (HIPC)High incomeHondurasHong Kong SAR, ChinaHungaryIBRD onlyIcelandIDA & IBRD totalIDA blendIDA onlyIDA totalIndiaIndonesiaIran, Islamic Rep.IraqIrelandIsraelItalyJamaicaJapanJordanKazakhstanKenyaKiribatiKorea, Rep.KuwaitKyrgyz RepublicLao PDRLate-demographic dividendLatin America & Caribbean Latin America & Caribbean (excluding high income)Latin America & the Caribbean (IDA & IBRD countries)LatviaLeast developed countries: UN classificationLebanonLesothoLiberiaLithuaniaLow & middle incomeLow incomeLower middle incomeLuxembourgMacao SAR, ChinaMacedonia, FYRMadagascarMalawiMalaysiaMaldivesMaliMaltaMauritiusMexicoMicronesia, Fed. Sts.Middle East & North AfricaMiddle East & North Africa (excluding high income)Middle East & North Africa (IDA & IBRD countries)Middle incomeMoldovaMongoliaMoroccoMozambiqueNamibiaNepalNetherlandsNew ZealandNicaraguaNorth AmericaNorwayOECD membersOmanOther small statesPakistanPanamaPapua New GuineaParaguayPeruPhilippinesPolandPortugalPost-demographic dividendPre-demographic dividendRomaniaRussian FederationRwandaSamoaSan MarinoSao Tome and PrincipeSenegalSerbiaSeychellesSierra LeoneSingaporeSlovak RepublicSloveniaSmall statesSolomon IslandsSouth AfricaSouth AsiaSouth Asia (IDA & IBRD)SpainSri LankaSt. Kitts and NevisSt. LuciaSub-Saharan Africa Sub-Saharan Africa (excluding high income)Sub-Saharan Africa (IDA & IBRD countries)SurinameSwazilandSwedenSwitzerlandSyrian Arab RepublicTajikistanTanzaniaThailandTimor-LesteTogoTrinidad and TobagoTunisiaTurkeyUgandaUkraineUnited KingdomUnited StatesUpper middle incomeUruguayVanuatuVenezuela, RBVietnamWest Bank and GazaWorldYemen, Rep.ZambiaZimbabwe Linea del tempo:
Questa scala temporale mostra un grafico dal 1981 anno al 2015 anno. Maldives. I dati fino ad 1980 anno non disponibili. Il numero di osservazioni attuali secondo i date: 33.
La fonte (nome):
Indicatori dello sviluppo mondiale
La fonte (organizzazione):
International Monetary Fund, Government Finance Statistics Yearbook and data files.
Categorie:
Public Sector
sono stati aggiornati
23 apr 2017 anni
Indicatori delle variazioni dei valori per anni
Minima:
0.208
1 gen 2015 anni
Massimo:
4.083
1 gen 2012 anni
Alla data di osservazione
Valore
Variazione assoluta
La variazione rispetto al valore precedente
1 gen 1981 anni
0.351
+0.351
0.0%
1 gen 1982 anni
0.376
+0.025
7.14%
1 gen 1983 anni
0.347
-0.029
-7.8%
1 gen 1984 anni
0.414
+0.067
19.31%
1 gen 1985 anni
0.428
+0.015
3.52%
1 gen 1986 anni
0.756
+0.328
76.5%
1 gen 1987 anni
0.937
+0.182
24.03%
1 gen 1988 anni
0.617
-0.32
-34.14%
1 gen 1989 anni
0.652
+0.035
5.68%
1 gen 1990 anni
0.561
-0.091
-13.98%
1 gen 1991 anni
0.648
+0.087
15.55%
1 gen 1992 anni
0.504
-0.145
-22.29%
1 gen 1993 anni
0.503
0.0
-0.08%
1 gen 1994 anni
0.545
+0.042
8.26%
1 gen 1995 anni
0.569
+0.024
4.41%
1 gen 1996 anni
0.47
-0.099
-17.45%
1 gen 1997 anni
0.562
+0.093
19.74%
1 gen 1998 anni
0.615
+0.053
9.39%
1 gen 1999 anni
0.581
-0.034
-5.6%
1 gen 2000 anni
0.5
-0.081
-13.97%
1 gen 2001 anni
0.566
+0.066
13.22%
1 gen 2002 anni
0.475
-0.091
-16.07%
1 gen 2003 anni
0.373
-0.102
-21.53%
1 gen 2004 anni
0.346
-0.026
-7.05%
1 gen 2005 anni
0.358
+0.012
3.48%
1 gen 2006 anni
0.376
+0.017
4.83%
1 gen 2007 anni
0.747
+0.371
98.81%
1 gen 2008 anni
0.555
-0.192
-25.73%
1 gen 2009 anni
0.535
-0.019
-3.48%
1 gen 2010 anni
0.474
-0.062
-11.53%
1 gen 2011 anni
0.568
+0.094
19.89%
1 gen 2012 anni
4.083
+3.515
618.96%
1 gen 2015 anni
0.208
-3.875
-94.9%
Classificazione dei paesi secondo i statistiche attuali per anni


Commenti: