29
/it/
it
AIzaSyAYiBZKx7MnpbEhh9jyipgxe19OcubqV5w
April 1, 2024
48123
Middle East & North Africa
MEA
false
2
1
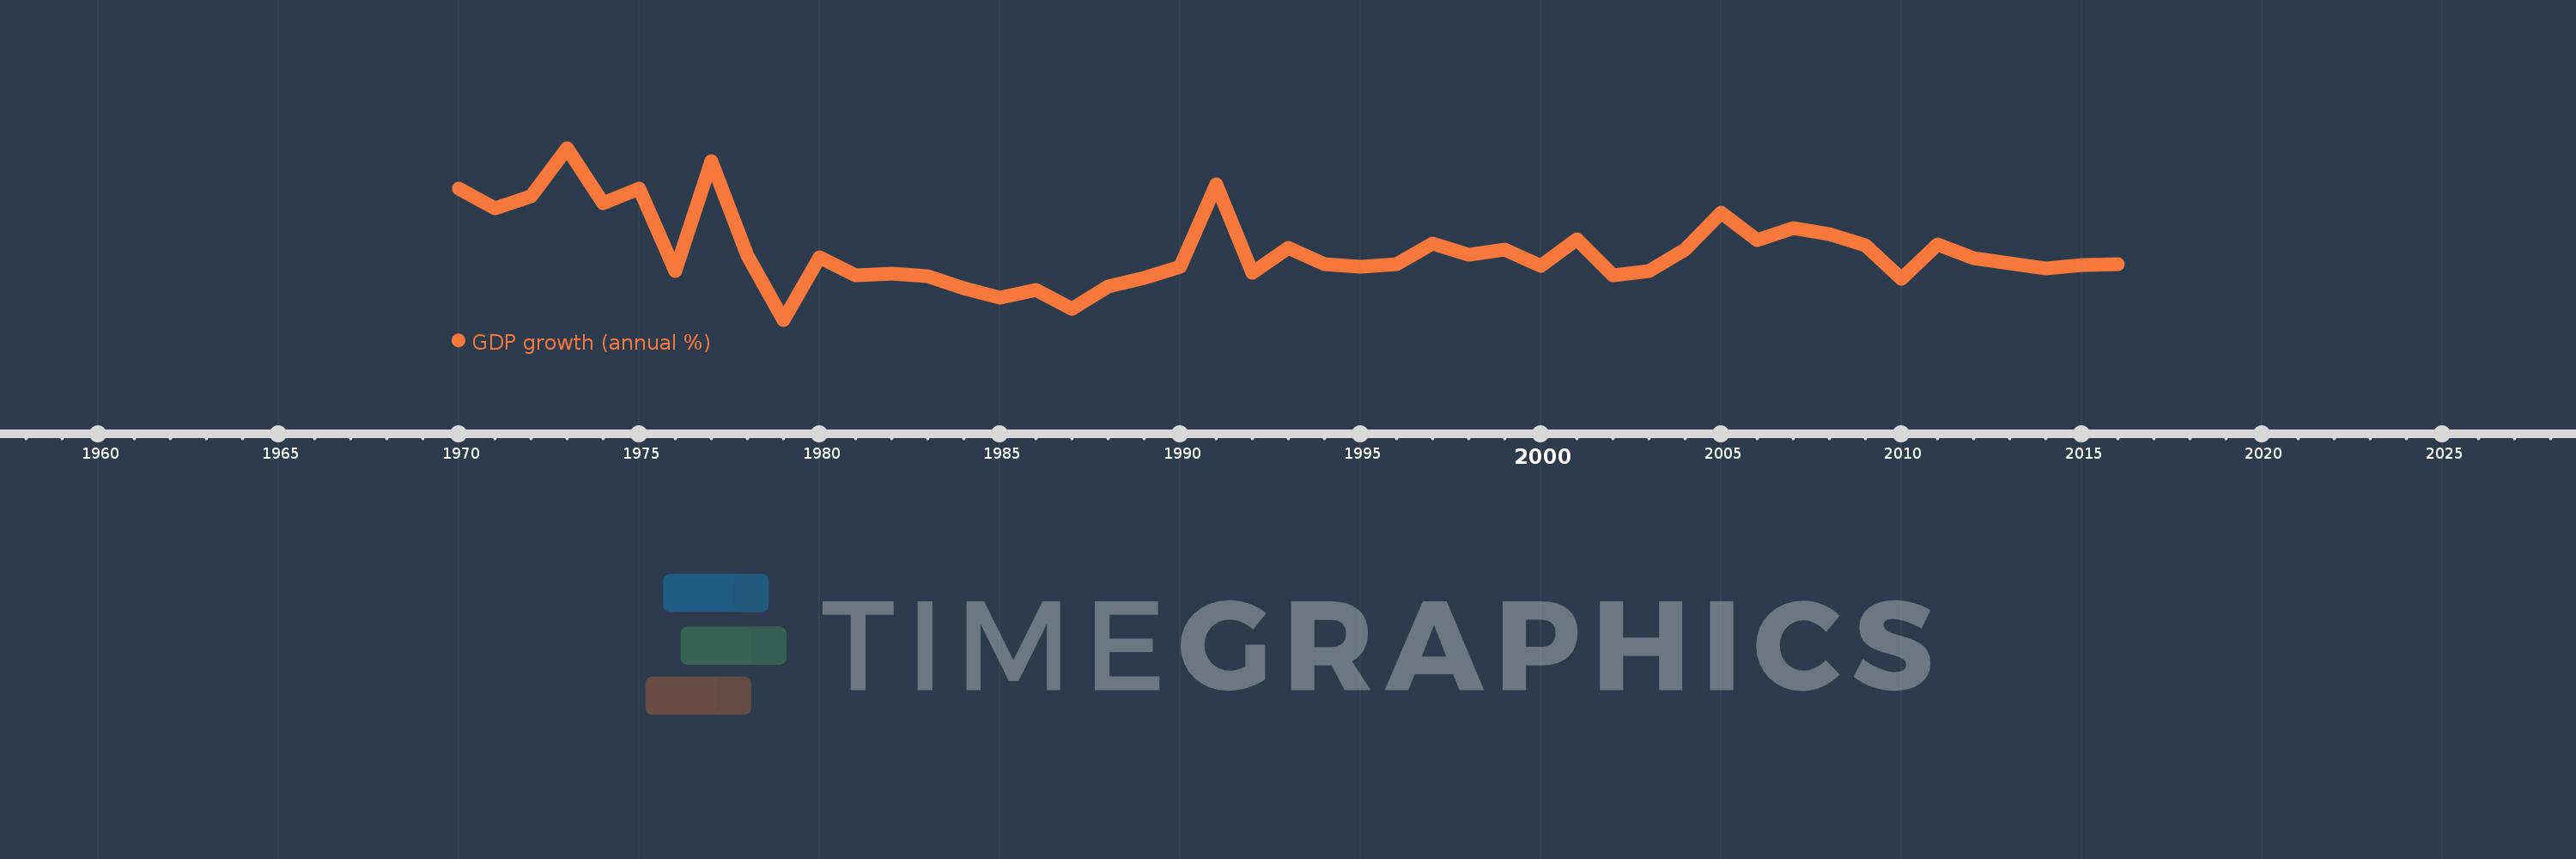
GDP growth (annual %)
2016,2015,2014,2013,2012,2011,2010,2009,2008,2007,2006,2005,2004,2003,2002,2001,2000,1999,1998,1997,1996,1995,1994,1993,1992,1991,1990,1989,1988,1987,1986,1985,1984,1983,1982,1981,1980,1979,1978,1977,1976,1975,1974,1973,1972,1971,1970
Queste statistiche in altri paesi:
AfghanistanAlbaniaAlgeriaAndorraAngolaAntigua and BarbudaArab WorldArgentinaArmeniaArubaAustraliaAustriaAzerbaijanBahamas, TheBahrainBangladeshBarbadosBelarusBelgiumBelizeBeninBermudaBhutanBoliviaBosnia and HerzegovinaBotswanaBrazilBrunei DarussalamBulgariaBurkina FasoBurundiCabo VerdeCambodiaCameroonCanadaCaribbean small statesCayman IslandsCentral African RepublicCentral Europe and the BalticsChadChannel IslandsChileChinaColombiaComorosCongo, Dem. Rep.Congo, Rep.Costa RicaCote d'IvoireCroatiaCubaCyprusCzech RepublicDenmarkDjiboutiDominicaDominican RepublicEarly-demographic dividendEast Asia & PacificEast Asia & Pacific (excluding high income)East Asia & Pacific (IDA & IBRD countries)EcuadorEgypt, Arab Rep.El SalvadorEquatorial GuineaEritreaEstoniaEthiopiaEuro areaEurope & Central AsiaEurope & Central Asia (excluding high income)Europe & Central Asia (IDA & IBRD countries)European UnionFijiFinlandFragile and conflict affected situationsFranceFrench PolynesiaGabonGambia, TheGeorgiaGermanyGhanaGreeceGreenlandGrenadaGuatemalaGuineaGuinea-BissauGuyanaHaitiHeavily indebted poor countries (HIPC)High incomeHondurasHong Kong SAR, ChinaHungaryIBRD onlyIcelandIDA & IBRD totalIDA blendIDA onlyIDA totalIndiaIndonesiaIran, Islamic Rep.IraqIrelandIsle of ManIsraelItalyJamaicaJapanJordanKazakhstanKenyaKiribatiKorea, Rep.KosovoKuwaitKyrgyz RepublicLao PDRLate-demographic dividendLatin America & Caribbean Latin America & Caribbean (excluding high income)Latin America & the Caribbean (IDA & IBRD countries)LatviaLeast developed countries: UN classificationLebanonLesothoLiberiaLibyaLiechtensteinLithuaniaLow & middle incomeLow incomeLower middle incomeLuxembourgMacao SAR, ChinaMacedonia, FYRMadagascarMalawiMalaysiaMaldivesMaliMaltaMarshall IslandsMauritaniaMauritiusMexicoMicronesia, Fed. Sts.Middle East & North AfricaMiddle East & North Africa (excluding high income)Middle East & North Africa (IDA & IBRD countries)Middle incomeMoldovaMonacoMongoliaMontenegroMoroccoMozambiqueMyanmarNamibiaNauruNepalNetherlandsNew CaledoniaNew ZealandNicaraguaNigerNigeriaNorth AmericaNorwayOECD membersOmanOther small statesPacific island small statesPakistanPalauPanamaPapua New GuineaParaguayPeruPhilippinesPolandPortugalPost-demographic dividendPre-demographic dividendPuerto RicoQatarRomaniaRussian FederationRwandaSamoaSan MarinoSao Tome and PrincipeSaudi ArabiaSenegalSerbiaSeychellesSierra LeoneSingaporeSlovak RepublicSloveniaSmall statesSolomon IslandsSomaliaSouth AfricaSouth AsiaSouth Asia (IDA & IBRD)South SudanSpainSri LankaSt. Kitts and NevisSt. LuciaSt. Vincent and the GrenadinesSub-Saharan Africa Sub-Saharan Africa (excluding high income)Sub-Saharan Africa (IDA & IBRD countries)SudanSurinameSwazilandSwedenSwitzerlandSyrian Arab RepublicTajikistanTanzaniaThailandTimor-LesteTogoTongaTrinidad and TobagoTunisiaTurkeyTurkmenistanTuvaluUgandaUkraineUnited Arab EmiratesUnited KingdomUnited StatesUpper middle incomeUruguayUzbekistanVanuatuVenezuela, RBVietnamVirgin Islands (U.S.)West Bank and GazaWorldYemen, Rep.ZambiaZimbabwe Linea del tempo:
Questa scala temporale mostra un grafico dal 1970 anno al 2016 anno. Middle East & North Africa. I dati fino ad 1969 anno non disponibili. Il numero di osservazioni attuali secondo i date: 47.
La fonte (nome):
Indicatori dello sviluppo mondiale
La fonte (organizzazione):
World Bank national accounts data, and OECD National Accounts data files.
Categorie:
Economy & Growth
sono stati aggiornati
23 apr 2017 anni
Indicatori delle variazioni dei valori per anni
Minima:
-2.658
1 gen 1979 anni
Massimo:
15.107
1 gen 1973 anni
Alla data di osservazione
Valore
Variazione assoluta
La variazione rispetto al valore precedente
1 gen 1970 anni
10.915
+10.915
0.0%
1 gen 1971 anni
8.884
-2.032
-18.61%
1 gen 1972 anni
10.082
+1.199
13.49%
1 gen 1973 anni
15.107
+5.024
49.83%
1 gen 1974 anni
9.386
-5.72
-37.87%
1 gen 1975 anni
10.88
+1.493
15.91%
1 gen 1976 anni
2.4
-8.479
-77.94%
1 gen 1977 anni
13.768
+11.368
473.58%
1 gen 1978 anni
4.001
-9.767
-70.94%
1 gen 1979 anni
-2.658
-6.659
-166.42%
1 gen 1980 anni
3.787
+6.445
-242.49%
1 gen 1981 anni
1.907
-1.88
-49.64%
1 gen 1982 anni
2.122
+0.215
11.26%
1 gen 1983 anni
1.852
-0.27
-12.72%
1 gen 1984 anni
0.634
-1.218
-65.75%
1 gen 1985 anni
-0.341
-0.975
-153.72%
1 gen 1986 anni
0.454
+0.795
-233.28%
1 gen 1987 anni
-1.569
-2.023
-445.36%
1 gen 1988 anni
0.799
+2.368
-150.94%
1 gen 1989 anni
1.689
+0.89
111.42%
1 gen 1990 anni
2.84
+1.15
68.08%
1 gen 1991 anni
11.325
+8.486
298.85%
1 gen 1992 anni
2.179
-9.146
-80.76%
1 gen 1993 anni
4.736
+2.557
117.34%
1 gen 1994 anni
3.053
-1.683
-35.53%
1 gen 1995 anni
2.84
-0.214
-7.0%
1 gen 1996 anni
3.131
+0.292
10.27%
1 gen 1997 anni
5.239
+2.108
67.31%
1 gen 1998 anni
4.031
-1.208
-23.07%
1 gen 1999 anni
4.622
+0.591
14.66%
1 gen 2000 anni
2.93
-1.691
-36.59%
1 gen 2001 anni
5.623
+2.692
91.86%
1 gen 2002 anni
1.942
-3.681
-65.47%
1 gen 2003 anni
2.35
+0.408
21.03%
1 gen 2004 anni
4.632
+2.282
97.12%
1 gen 2005 anni
8.398
+3.766
81.3%
1 gen 2006 anni
5.607
-2.791
-33.23%
1 gen 2007 anni
6.799
+1.192
21.26%
1 gen 2008 anni
6.159
-0.64
-9.41%
1 gen 2009 anni
5.024
-1.136
-18.44%
1 gen 2010 anni
1.575
-3.449
-68.66%
1 gen 2011 anni
5.106
+3.531
224.27%
1 gen 2012 anni
3.71
-1.395
-27.33%
1 gen 2013 anni
3.148
-0.563
-15.16%
1 gen 2014 anni
2.651
-0.497
-15.78%
1 gen 2015 anni
3.031
+0.38
14.33%
1 gen 2016 anni
3.087
+0.056
1.85%
Classificazione dei paesi secondo i statistiche attuali per anni


Commenti: