29
/it/
it
AIzaSyAYiBZKx7MnpbEhh9jyipgxe19OcubqV5w
April 1, 2024
28122
East Asia & Pacific (excluding high income)
EAP
false
2
1
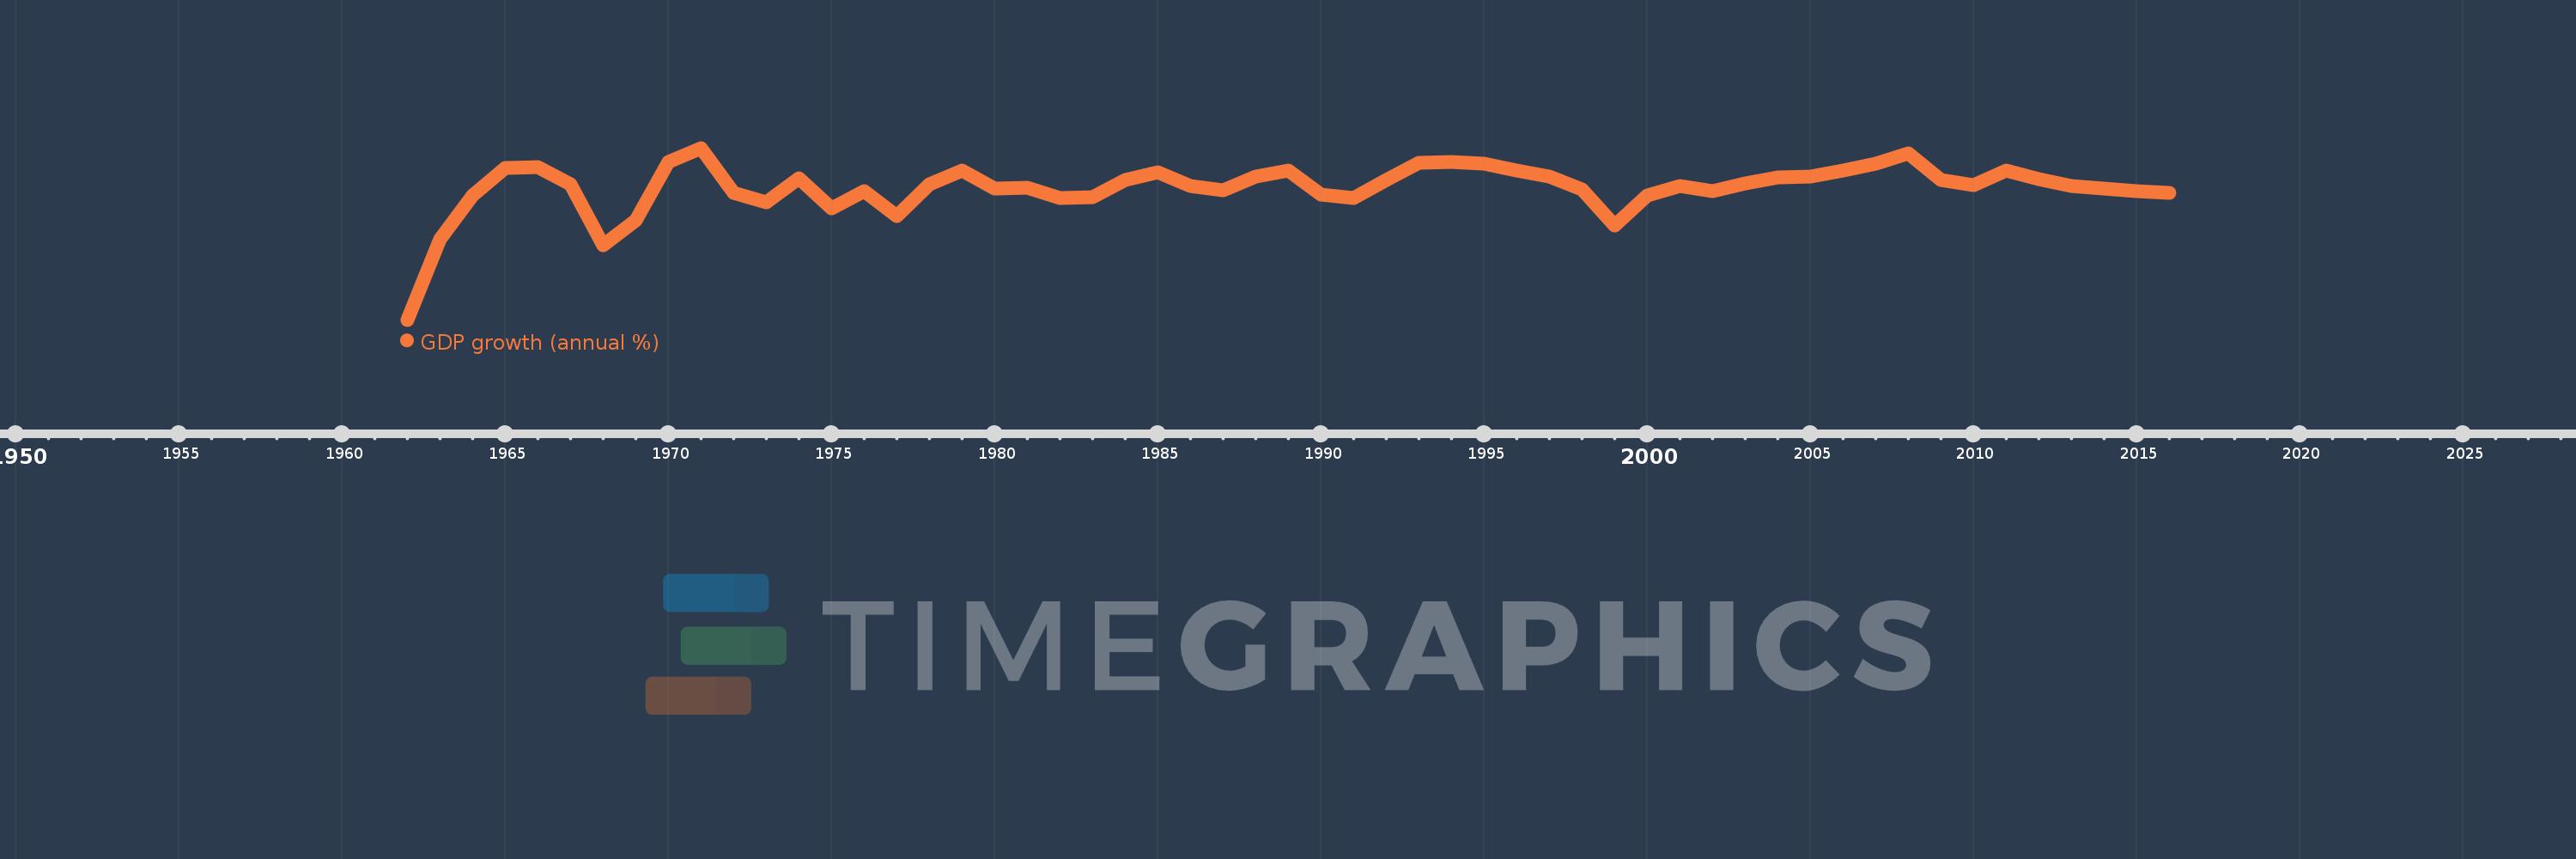
GDP growth (annual %)
2016,2015,2014,2013,2012,2011,2010,2009,2008,2007,2006,2005,2004,2003,2002,2001,2000,1999,1998,1997,1996,1995,1994,1993,1992,1991,1990,1989,1988,1987,1986,1985,1984,1983,1982,1981,1980,1979,1978,1977,1976,1975,1974,1973,1972,1971,1970,1969,1968,1967,1966,1965,1964,1963,1962
Queste statistiche in altri paesi:
AfghanistanAlbaniaAlgeriaAndorraAngolaAntigua and BarbudaArab WorldArgentinaArmeniaArubaAustraliaAustriaAzerbaijanBahamas, TheBahrainBangladeshBarbadosBelarusBelgiumBelizeBeninBermudaBhutanBoliviaBosnia and HerzegovinaBotswanaBrazilBrunei DarussalamBulgariaBurkina FasoBurundiCabo VerdeCambodiaCameroonCanadaCaribbean small statesCayman IslandsCentral African RepublicCentral Europe and the BalticsChadChannel IslandsChileChinaColombiaComorosCongo, Dem. Rep.Congo, Rep.Costa RicaCote d'IvoireCroatiaCubaCyprusCzech RepublicDenmarkDjiboutiDominicaDominican RepublicEarly-demographic dividendEast Asia & PacificEast Asia & Pacific (excluding high income)East Asia & Pacific (IDA & IBRD countries)EcuadorEgypt, Arab Rep.El SalvadorEquatorial GuineaEritreaEstoniaEthiopiaEuro areaEurope & Central AsiaEurope & Central Asia (excluding high income)Europe & Central Asia (IDA & IBRD countries)European UnionFijiFinlandFragile and conflict affected situationsFranceFrench PolynesiaGabonGambia, TheGeorgiaGermanyGhanaGreeceGreenlandGrenadaGuatemalaGuineaGuinea-BissauGuyanaHaitiHeavily indebted poor countries (HIPC)High incomeHondurasHong Kong SAR, ChinaHungaryIBRD onlyIcelandIDA & IBRD totalIDA blendIDA onlyIDA totalIndiaIndonesiaIran, Islamic Rep.IraqIrelandIsle of ManIsraelItalyJamaicaJapanJordanKazakhstanKenyaKiribatiKorea, Rep.KosovoKuwaitKyrgyz RepublicLao PDRLate-demographic dividendLatin America & Caribbean Latin America & Caribbean (excluding high income)Latin America & the Caribbean (IDA & IBRD countries)LatviaLeast developed countries: UN classificationLebanonLesothoLiberiaLibyaLiechtensteinLithuaniaLow & middle incomeLow incomeLower middle incomeLuxembourgMacao SAR, ChinaMacedonia, FYRMadagascarMalawiMalaysiaMaldivesMaliMaltaMarshall IslandsMauritaniaMauritiusMexicoMicronesia, Fed. Sts.Middle East & North AfricaMiddle East & North Africa (excluding high income)Middle East & North Africa (IDA & IBRD countries)Middle incomeMoldovaMonacoMongoliaMontenegroMoroccoMozambiqueMyanmarNamibiaNauruNepalNetherlandsNew CaledoniaNew ZealandNicaraguaNigerNigeriaNorth AmericaNorwayOECD membersOmanOther small statesPacific island small statesPakistanPalauPanamaPapua New GuineaParaguayPeruPhilippinesPolandPortugalPost-demographic dividendPre-demographic dividendPuerto RicoQatarRomaniaRussian FederationRwandaSamoaSan MarinoSao Tome and PrincipeSaudi ArabiaSenegalSerbiaSeychellesSierra LeoneSingaporeSlovak RepublicSloveniaSmall statesSolomon IslandsSomaliaSouth AfricaSouth AsiaSouth Asia (IDA & IBRD)South SudanSpainSri LankaSt. Kitts and NevisSt. LuciaSt. Vincent and the GrenadinesSub-Saharan Africa Sub-Saharan Africa (excluding high income)Sub-Saharan Africa (IDA & IBRD countries)SudanSurinameSwazilandSwedenSwitzerlandSyrian Arab RepublicTajikistanTanzaniaThailandTimor-LesteTogoTongaTrinidad and TobagoTunisiaTurkeyTurkmenistanTuvaluUgandaUkraineUnited Arab EmiratesUnited KingdomUnited StatesUpper middle incomeUruguayUzbekistanVanuatuVenezuela, RBVietnamVirgin Islands (U.S.)West Bank and GazaWorldYemen, Rep.ZambiaZimbabwe Linea del tempo:
Questa scala temporale mostra un grafico dal 1962 anno al 2016 anno. East Asia & Pacific (excluding high income). I dati fino ad 1961 anno non disponibili. Il numero di osservazioni attuali secondo i date: 55.
La fonte (nome):
Indicatori dello sviluppo mondiale
La fonte (organizzazione):
World Bank national accounts data, and OECD National Accounts data files.
Categorie:
Economy & Growth
sono stati aggiornati
23 apr 2017 anni
Indicatori delle variazioni dei valori per anni
Minima:
-11.867
1 gen 1962 anni
Massimo:
13.044
1 gen 1971 anni
Alla data di osservazione
Valore
Variazione assoluta
La variazione rispetto al valore precedente
1 gen 1962 anni
-11.867
-11.867
0.0%
1 gen 1963 anni
-0.216
+11.651
-98.18%
1 gen 1964 anni
6.16
+6.376
-2.95 Mille.%
1 gen 1965 anni
10.135
+3.975
64.53%
1 gen 1966 anni
10.218
+0.083
0.82%
1 gen 1967 anni
7.78
-2.438
-23.86%
1 gen 1968 anni
-1.079
-8.859
-113.87%
1 gen 1969 anni
2.579
+3.658
-338.99%
1 gen 1970 anni
11.031
+8.452
327.72%
1 gen 1971 anni
13.044
+2.014
18.25%
1 gen 1972 anni
6.53
-6.514
-49.94%
1 gen 1973 anni
5.214
-1.316
-20.16%
1 gen 1974 anni
8.687
+3.473
66.62%
1 gen 1975 anni
4.335
-4.352
-50.1%
1 gen 1976 anni
6.788
+2.454
56.6%
1 gen 1977 anni
3.139
-3.65
-53.77%
1 gen 1978 anni
7.721
+4.582
146.0%
1 gen 1979 anni
9.752
+2.032
26.31%
1 gen 1980 anni
7.097
-2.656
-27.23%
1 gen 1981 anni
7.332
+0.235
3.31%
1 gen 1982 anni
5.82
-1.511
-20.61%
1 gen 1983 anni
5.881
+0.061
1.05%
1 gen 1984 anni
8.395
+2.514
42.75%
1 gen 1985 anni
9.552
+1.157
13.78%
1 gen 1986 anni
7.517
-2.035
-21.3%
1 gen 1987 anni
6.963
-0.555
-7.38%
1 gen 1988 anni
8.948
+1.985
28.51%
1 gen 1989 anni
9.711
+0.762
8.52%
1 gen 1990 anni
6.229
-3.481
-35.85%
1 gen 1991 anni
5.742
-0.487
-7.82%
1 gen 1992 anni
8.347
+2.605
45.36%
1 gen 1993 anni
10.915
+2.568
30.77%
1 gen 1994 anni
11.032
+0.117
1.07%
1 gen 1995 anni
10.77
-0.262
-2.37%
1 gen 1996 anni
9.774
-0.996
-9.25%
1 gen 1997 anni
8.911
-0.863
-8.83%
1 gen 1998 anni
7.048
-1.863
-20.91%
1 gen 1999 anni
1.762
-5.286
-75.0%
1 gen 2000 anni
6.116
+4.354
247.07%
1 gen 2001 anni
7.514
+1.399
22.87%
1 gen 2002 anni
6.717
-0.798
-10.61%
1 gen 2003 anni
7.867
+1.15
17.12%
1 gen 2004 anni
8.732
+0.865
11.0%
1 gen 2005 anni
8.926
+0.195
2.23%
1 gen 2006 anni
9.709
+0.783
8.77%
1 gen 2007 anni
10.765
+1.055
10.87%
1 gen 2008 anni
12.288
+1.523
14.15%
1 gen 2009 anni
8.387
-3.901
-31.74%
1 gen 2010 anni
7.663
-0.725
-8.64%
1 gen 2011 anni
9.766
+2.104
27.45%
1 gen 2012 anni
8.474
-1.292
-13.23%
1 gen 2013 anni
7.514
-0.96
-11.33%
1 gen 2014 anni
7.207
-0.307
-4.08%
1 gen 2015 anni
6.761
-0.447
-6.2%
1 gen 2016 anni
6.485
-0.276
-4.08%
Classificazione dei paesi secondo i statistiche attuali per anni


Commenti: