29
/it/
it
AIzaSyAYiBZKx7MnpbEhh9jyipgxe19OcubqV5w
April 1, 2024
46101
Low income
LIC
false
2
1
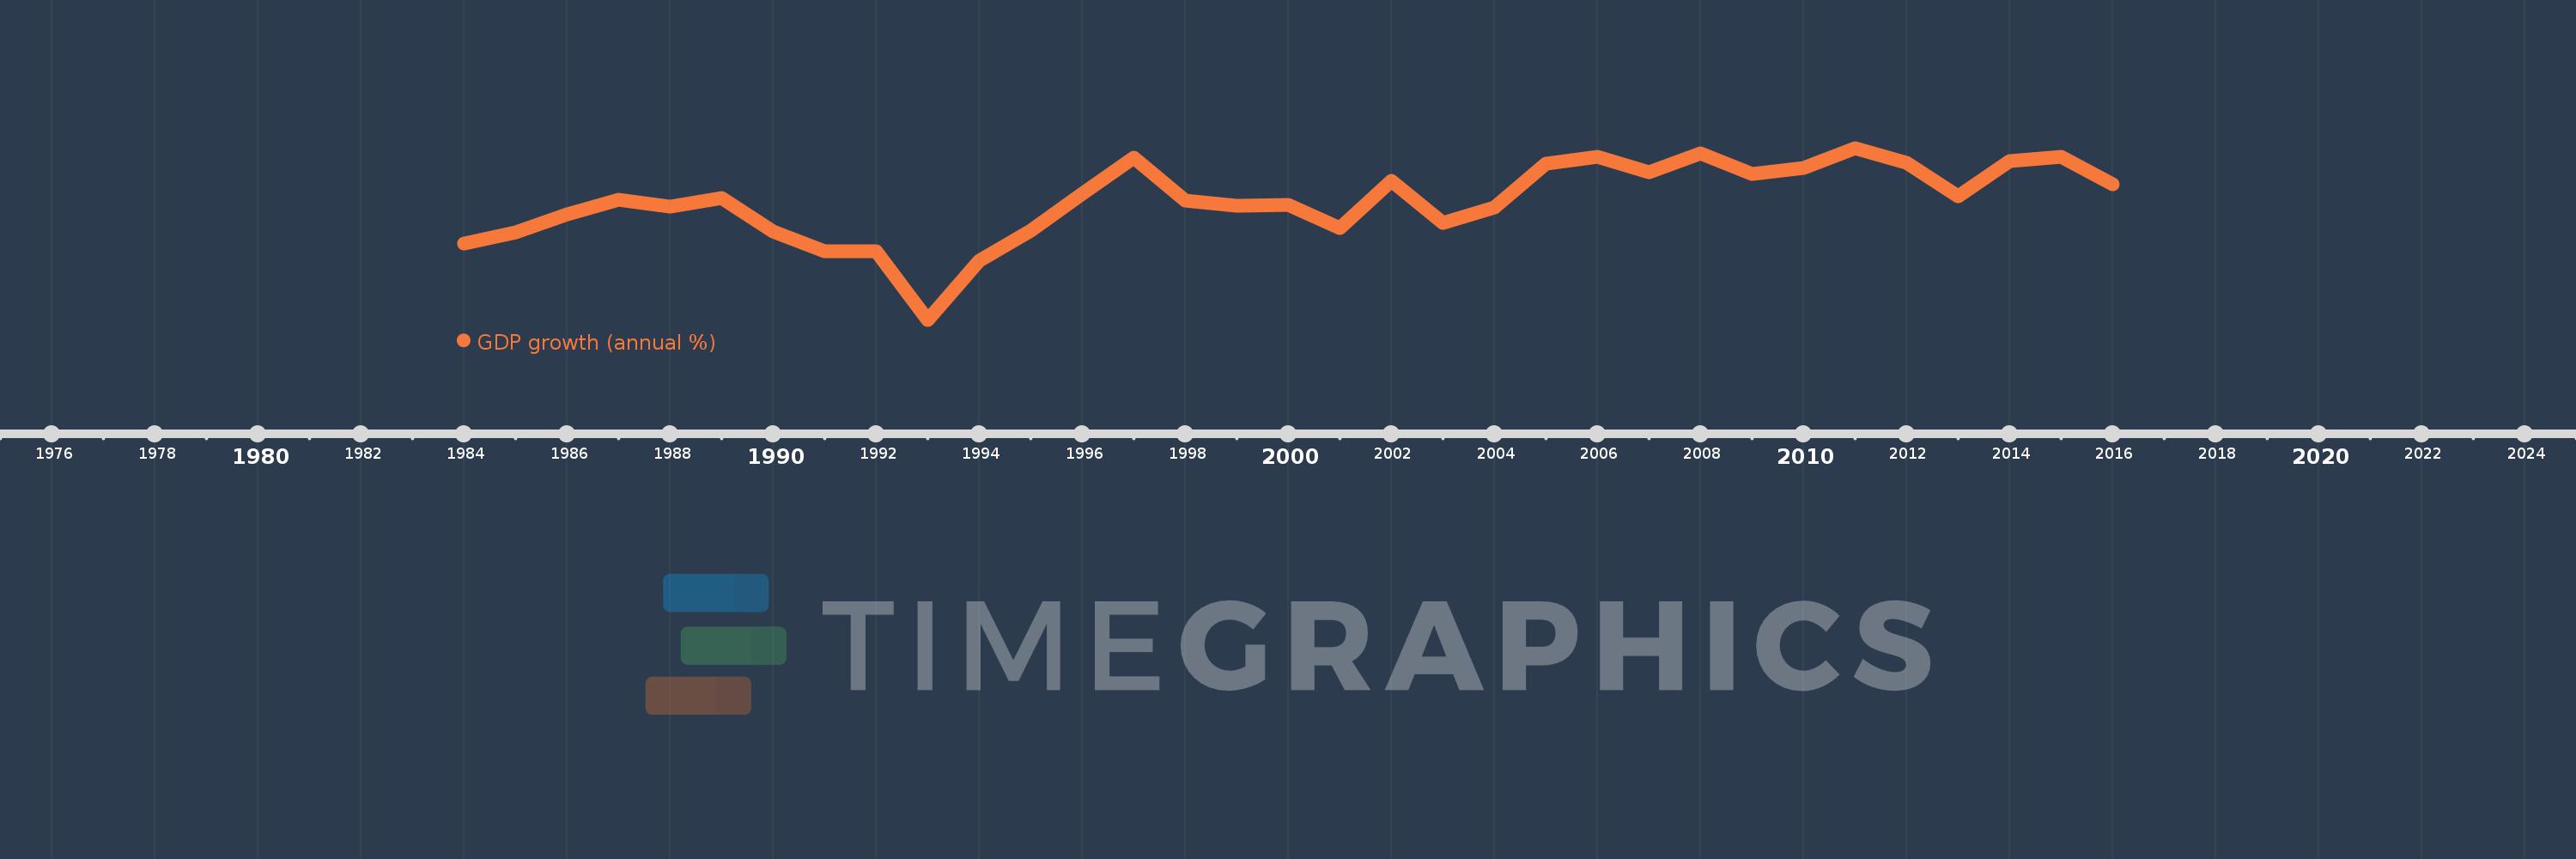
GDP growth (annual %)
2016,2015,2014,2013,2012,2011,2010,2009,2008,2007,2006,2005,2004,2003,2002,2001,2000,1999,1998,1997,1996,1995,1994,1993,1992,1991,1990,1989,1988,1987,1986,1985,1984
Queste statistiche in altri paesi:
AfghanistanAlbaniaAlgeriaAndorraAngolaAntigua and BarbudaArab WorldArgentinaArmeniaArubaAustraliaAustriaAzerbaijanBahamas, TheBahrainBangladeshBarbadosBelarusBelgiumBelizeBeninBermudaBhutanBoliviaBosnia and HerzegovinaBotswanaBrazilBrunei DarussalamBulgariaBurkina FasoBurundiCabo VerdeCambodiaCameroonCanadaCaribbean small statesCayman IslandsCentral African RepublicCentral Europe and the BalticsChadChannel IslandsChileChinaColombiaComorosCongo, Dem. Rep.Congo, Rep.Costa RicaCote d'IvoireCroatiaCubaCyprusCzech RepublicDenmarkDjiboutiDominicaDominican RepublicEarly-demographic dividendEast Asia & PacificEast Asia & Pacific (excluding high income)East Asia & Pacific (IDA & IBRD countries)EcuadorEgypt, Arab Rep.El SalvadorEquatorial GuineaEritreaEstoniaEthiopiaEuro areaEurope & Central AsiaEurope & Central Asia (excluding high income)Europe & Central Asia (IDA & IBRD countries)European UnionFijiFinlandFragile and conflict affected situationsFranceFrench PolynesiaGabonGambia, TheGeorgiaGermanyGhanaGreeceGreenlandGrenadaGuatemalaGuineaGuinea-BissauGuyanaHaitiHeavily indebted poor countries (HIPC)High incomeHondurasHong Kong SAR, ChinaHungaryIBRD onlyIcelandIDA & IBRD totalIDA blendIDA onlyIDA totalIndiaIndonesiaIran, Islamic Rep.IraqIrelandIsle of ManIsraelItalyJamaicaJapanJordanKazakhstanKenyaKiribatiKorea, Rep.KosovoKuwaitKyrgyz RepublicLao PDRLate-demographic dividendLatin America & Caribbean Latin America & Caribbean (excluding high income)Latin America & the Caribbean (IDA & IBRD countries)LatviaLeast developed countries: UN classificationLebanonLesothoLiberiaLibyaLiechtensteinLithuaniaLow & middle incomeLow incomeLower middle incomeLuxembourgMacao SAR, ChinaMacedonia, FYRMadagascarMalawiMalaysiaMaldivesMaliMaltaMarshall IslandsMauritaniaMauritiusMexicoMicronesia, Fed. Sts.Middle East & North AfricaMiddle East & North Africa (excluding high income)Middle East & North Africa (IDA & IBRD countries)Middle incomeMoldovaMonacoMongoliaMontenegroMoroccoMozambiqueMyanmarNamibiaNauruNepalNetherlandsNew CaledoniaNew ZealandNicaraguaNigerNigeriaNorth AmericaNorwayOECD membersOmanOther small statesPacific island small statesPakistanPalauPanamaPapua New GuineaParaguayPeruPhilippinesPolandPortugalPost-demographic dividendPre-demographic dividendPuerto RicoQatarRomaniaRussian FederationRwandaSamoaSan MarinoSao Tome and PrincipeSaudi ArabiaSenegalSerbiaSeychellesSierra LeoneSingaporeSlovak RepublicSloveniaSmall statesSolomon IslandsSomaliaSouth AfricaSouth AsiaSouth Asia (IDA & IBRD)South SudanSpainSri LankaSt. Kitts and NevisSt. LuciaSt. Vincent and the GrenadinesSub-Saharan Africa Sub-Saharan Africa (excluding high income)Sub-Saharan Africa (IDA & IBRD countries)SudanSurinameSwazilandSwedenSwitzerlandSyrian Arab RepublicTajikistanTanzaniaThailandTimor-LesteTogoTongaTrinidad and TobagoTunisiaTurkeyTurkmenistanTuvaluUgandaUkraineUnited Arab EmiratesUnited KingdomUnited StatesUpper middle incomeUruguayUzbekistanVanuatuVenezuela, RBVietnamVirgin Islands (U.S.)West Bank and GazaWorldYemen, Rep.ZambiaZimbabwe Linea del tempo:
Questa scala temporale mostra un grafico dal 1984 anno al 2016 anno. Low income. I dati fino ad 1983 anno non disponibili. Il numero di osservazioni attuali secondo i date: 33.
La fonte (nome):
Indicatori dello sviluppo mondiale
La fonte (organizzazione):
World Bank national accounts data, and OECD National Accounts data files.
Categorie:
Economy & Growth
sono stati aggiornati
23 apr 2017 anni
Indicatori delle variazioni dei valori per anni
Minima:
-3.689
1 gen 1993 anni
Massimo:
6.565
1 gen 2011 anni
Alla data di osservazione
Valore
Variazione assoluta
La variazione rispetto al valore precedente
1 gen 1984 anni
0.864
+0.864
0.0%
1 gen 1985 anni
1.526
+0.662
76.61%
1 gen 1986 anni
2.62
+1.094
71.69%
1 gen 1987 anni
3.467
+0.847
32.34%
1 gen 1988 anni
3.08
-0.387
-11.15%
1 gen 1989 anni
3.594
+0.513
16.67%
1 gen 1990 anni
1.578
-2.016
-56.1%
1 gen 1991 anni
0.4
-1.178
-74.67%
1 gen 1992 anni
0.377
-0.023
-5.75%
1 gen 1993 anni
-3.689
-4.066
-1.08 Mille.%
1 gen 1994 anni
-0.178
+3.511
-95.17%
1 gen 1995 anni
1.624
+1.803
-1.01 Mille.%
1 gen 1996 anni
3.835
+2.211
136.09%
1 gen 1997 anni
5.968
+2.133
55.62%
1 gen 1998 anni
3.421
-2.547
-42.68%
1 gen 1999 anni
3.094
-0.327
-9.56%
1 gen 2000 anni
3.184
+0.09
2.91%
1 gen 2001 anni
1.795
-1.388
-43.61%
1 gen 2002 anni
4.621
+2.826
157.41%
1 gen 2003 anni
2.107
-2.514
-54.4%
1 gen 2004 anni
3.013
+0.906
42.98%
1 gen 2005 anni
5.644
+2.63
87.29%
1 gen 2006 anni
6.049
+0.406
7.19%
1 gen 2007 anni
5.098
-0.951
-15.72%
1 gen 2008 anni
6.25
+1.152
22.59%
1 gen 2009 anni
4.998
-1.252
-20.03%
1 gen 2010 anni
5.355
+0.358
7.15%
1 gen 2011 anni
6.565
+1.21
22.59%
1 gen 2012 anni
5.675
-0.89
-13.55%
1 gen 2013 anni
3.696
-1.98
-34.88%
1 gen 2014 anni
5.8
+2.104
56.92%
1 gen 2015 anni
6.058
+0.259
4.46%
1 gen 2016 anni
4.415
-1.643
-27.13%
Classificazione dei paesi secondo i statistiche attuali per anni


Commenti: