29
/it/
it
AIzaSyAYiBZKx7MnpbEhh9jyipgxe19OcubqV5w
April 1, 2024
269325
Turkey
TUR
true
2
1
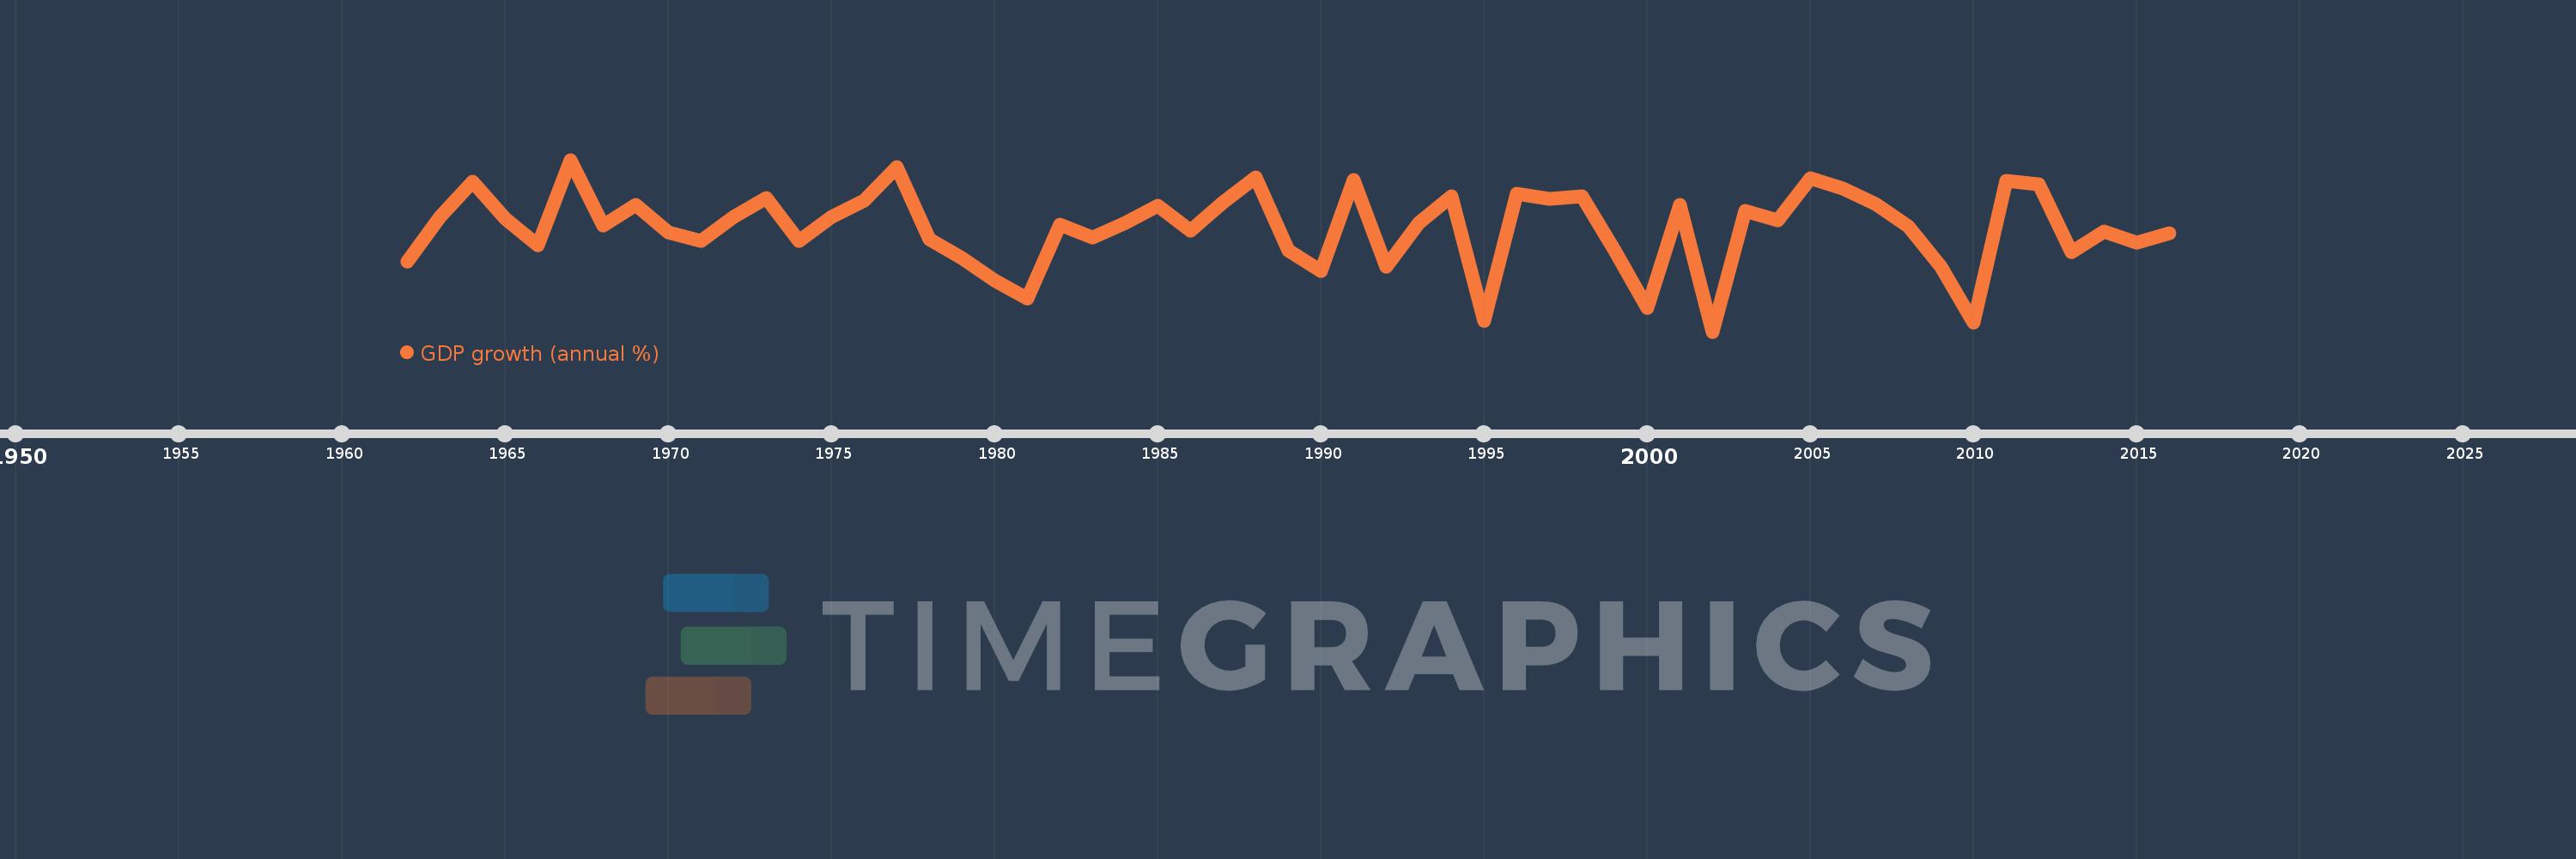
GDP growth (annual %)
2016,2015,2014,2013,2012,2011,2010,2009,2008,2007,2006,2005,2004,2003,2002,2001,2000,1999,1998,1997,1996,1995,1994,1993,1992,1991,1990,1989,1988,1987,1986,1985,1984,1983,1982,1981,1980,1979,1978,1977,1976,1975,1974,1973,1972,1971,1970,1969,1968,1967,1966,1965,1964,1963,1962
Queste statistiche in altri paesi:
AfghanistanAlbaniaAlgeriaAndorraAngolaAntigua and BarbudaArab WorldArgentinaArmeniaArubaAustraliaAustriaAzerbaijanBahamas, TheBahrainBangladeshBarbadosBelarusBelgiumBelizeBeninBermudaBhutanBoliviaBosnia and HerzegovinaBotswanaBrazilBrunei DarussalamBulgariaBurkina FasoBurundiCabo VerdeCambodiaCameroonCanadaCaribbean small statesCayman IslandsCentral African RepublicCentral Europe and the BalticsChadChannel IslandsChileChinaColombiaComorosCongo, Dem. Rep.Congo, Rep.Costa RicaCote d'IvoireCroatiaCubaCyprusCzech RepublicDenmarkDjiboutiDominicaDominican RepublicEarly-demographic dividendEast Asia & PacificEast Asia & Pacific (excluding high income)East Asia & Pacific (IDA & IBRD countries)EcuadorEgypt, Arab Rep.El SalvadorEquatorial GuineaEritreaEstoniaEthiopiaEuro areaEurope & Central AsiaEurope & Central Asia (excluding high income)Europe & Central Asia (IDA & IBRD countries)European UnionFijiFinlandFragile and conflict affected situationsFranceFrench PolynesiaGabonGambia, TheGeorgiaGermanyGhanaGreeceGreenlandGrenadaGuatemalaGuineaGuinea-BissauGuyanaHaitiHeavily indebted poor countries (HIPC)High incomeHondurasHong Kong SAR, ChinaHungaryIBRD onlyIcelandIDA & IBRD totalIDA blendIDA onlyIDA totalIndiaIndonesiaIran, Islamic Rep.IraqIrelandIsle of ManIsraelItalyJamaicaJapanJordanKazakhstanKenyaKiribatiKorea, Rep.KosovoKuwaitKyrgyz RepublicLao PDRLate-demographic dividendLatin America & Caribbean Latin America & Caribbean (excluding high income)Latin America & the Caribbean (IDA & IBRD countries)LatviaLeast developed countries: UN classificationLebanonLesothoLiberiaLibyaLiechtensteinLithuaniaLow & middle incomeLow incomeLower middle incomeLuxembourgMacao SAR, ChinaMacedonia, FYRMadagascarMalawiMalaysiaMaldivesMaliMaltaMarshall IslandsMauritaniaMauritiusMexicoMicronesia, Fed. Sts.Middle East & North AfricaMiddle East & North Africa (excluding high income)Middle East & North Africa (IDA & IBRD countries)Middle incomeMoldovaMonacoMongoliaMontenegroMoroccoMozambiqueMyanmarNamibiaNauruNepalNetherlandsNew CaledoniaNew ZealandNicaraguaNigerNigeriaNorth AmericaNorwayOECD membersOmanOther small statesPacific island small statesPakistanPalauPanamaPapua New GuineaParaguayPeruPhilippinesPolandPortugalPost-demographic dividendPre-demographic dividendPuerto RicoQatarRomaniaRussian FederationRwandaSamoaSan MarinoSao Tome and PrincipeSaudi ArabiaSenegalSerbiaSeychellesSierra LeoneSingaporeSlovak RepublicSloveniaSmall statesSolomon IslandsSomaliaSouth AfricaSouth AsiaSouth Asia (IDA & IBRD)South SudanSpainSri LankaSt. Kitts and NevisSt. LuciaSt. Vincent and the GrenadinesSub-Saharan Africa Sub-Saharan Africa (excluding high income)Sub-Saharan Africa (IDA & IBRD countries)SudanSurinameSwazilandSwedenSwitzerlandSyrian Arab RepublicTajikistanTanzaniaThailandTimor-LesteTogoTongaTrinidad and TobagoTunisiaTurkeyTurkmenistanTuvaluUgandaUkraineUnited Arab EmiratesUnited KingdomUnited StatesUpper middle incomeUruguayUzbekistanVanuatuVenezuela, RBVietnamVirgin Islands (U.S.)West Bank and GazaWorldYemen, Rep.ZambiaZimbabwe Linea del tempo:
Questa scala temporale mostra un grafico dal 1962 anno al 2016 anno. Turkey. I dati fino ad 1961 anno non disponibili. Il numero di osservazioni attuali secondo i date: 55.
La fonte (nome):
Indicatori dello sviluppo mondiale
La fonte (organizzazione):
World Bank national accounts data, and OECD National Accounts data files.
Categorie:
Economy & Growth
sono stati aggiornati
23 apr 2017 anni
Indicatori delle variazioni dei valori per anni
Minima:
-5.697
1 gen 2002 anni
Massimo:
11.213
1 gen 1967 anni
Alla data di osservazione
Valore
Variazione assoluta
La variazione rispetto al valore precedente
1 gen 1962 anni
1.156
+1.156
0.0%
1 gen 1963 anni
5.571
+4.415
381.93%
1 gen 1964 anni
9.066
+3.495
62.73%
1 gen 1965 anni
5.459
-3.607
-39.79%
1 gen 1966 anni
2.824
-2.636
-48.28%
1 gen 1967 anni
11.213
+8.389
297.12%
1 gen 1968 anni
4.733
-6.48
-57.79%
1 gen 1969 anni
6.778
+2.045
43.22%
1 gen 1970 anni
4.081
-2.697
-39.79%
1 gen 1971 anni
3.234
-0.848
-20.77%
1 gen 1972 anni
5.567
+2.333
72.16%
1 gen 1973 anni
7.426
+1.859
33.4%
1 gen 1974 anni
3.262
-4.163
-56.07%
1 gen 1975 anni
5.594
+2.332
71.49%
1 gen 1976 anni
7.174
+1.58
28.24%
1 gen 1977 anni
10.461
+3.287
45.82%
1 gen 1978 anni
3.407
-7.055
-67.44%
1 gen 1979 anni
1.503
-1.904
-55.88%
1 gen 1980 anni
-0.624
-2.127
-141.53%
1 gen 1981 anni
-2.447
-1.823
292.13%
1 gen 1982 anni
4.857
+7.304
-298.45%
1 gen 1983 anni
3.563
-1.293
-26.63%
1 gen 1984 anni
4.971
+1.408
39.51%
1 gen 1985 anni
6.712
+1.741
35.02%
1 gen 1986 anni
4.241
-2.471
-36.81%
1 gen 1987 anni
7.012
+2.771
65.33%
1 gen 1988 anni
9.486
+2.474
35.28%
1 gen 1989 anni
2.321
-7.165
-75.53%
1 gen 1990 anni
0.29
-2.03
-87.49%
1 gen 1991 anni
9.266
+8.976
3.09 Mille.%
1 gen 1992 anni
0.72
-8.546
-92.23%
1 gen 1993 anni
5.036
+4.315
599.12%
1 gen 1994 anni
7.651
+2.616
51.94%
1 gen 1995 anni
-4.668
-12.319
-161.01%
1 gen 1996 anni
7.878
+12.546
-268.77%
1 gen 1997 anni
7.38
-0.499
-6.33%
1 gen 1998 anni
7.578
+0.198
2.68%
1 gen 1999 anni
2.308
-5.269
-69.54%
1 gen 2000 anni
-3.365
-5.674
-245.8%
1 gen 2001 anni
6.774
+10.14
-301.3%
1 gen 2002 anni
-5.697
-12.472
-184.1%
1 gen 2003 anni
6.164
+11.861
-208.19%
1 gen 2004 anni
5.265
-0.899
-14.58%
1 gen 2005 anni
9.363
+4.098
77.82%
1 gen 2006 anni
8.402
-0.961
-10.27%
1 gen 2007 anni
6.893
-1.508
-17.95%
1 gen 2008 anni
4.669
-2.225
-32.28%
1 gen 2009 anni
0.659
-4.01
-85.89%
1 gen 2010 anni
-4.826
-5.485
-832.48%
1 gen 2011 anni
9.157
+13.983
-289.75%
1 gen 2012 anni
8.773
-0.384
-4.2%
1 gen 2013 anni
2.127
-6.645
-75.75%
1 gen 2014 anni
4.193
+2.065
97.07%
1 gen 2015 anni
3.02
-1.172
-27.96%
1 gen 2016 anni
3.972
+0.952
31.52%
Classificazione dei paesi secondo i statistiche attuali per anni


Commenti: