29
/it/
it
AIzaSyAYiBZKx7MnpbEhh9jyipgxe19OcubqV5w
April 1, 2024
178854
Liberia
LBR
true
2
1
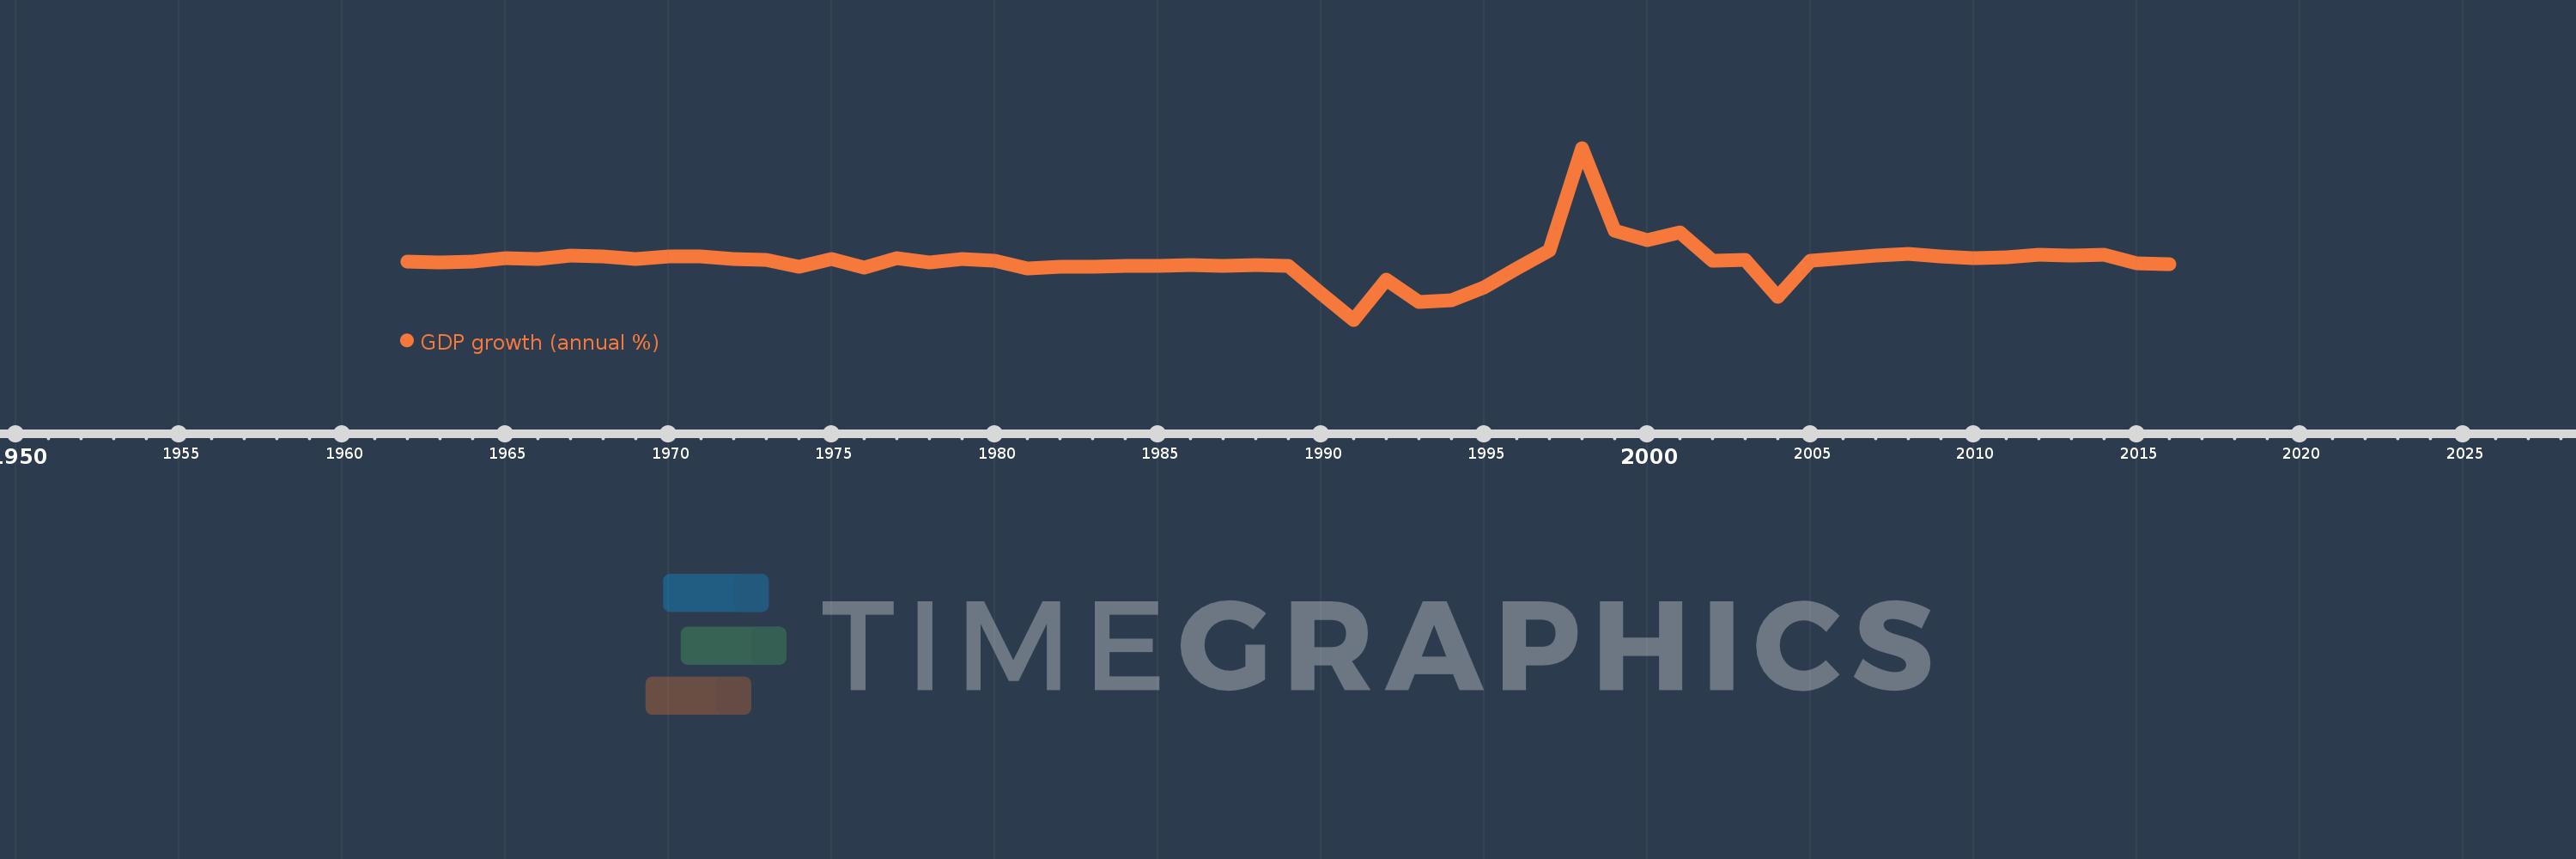
GDP growth (annual %)
2016,2015,2014,2013,2012,2011,2010,2009,2008,2007,2006,2005,2004,2003,2002,2001,2000,1999,1998,1997,1996,1995,1994,1993,1992,1991,1990,1989,1988,1987,1986,1985,1984,1983,1982,1981,1980,1979,1978,1977,1976,1975,1974,1973,1972,1971,1970,1969,1968,1967,1966,1965,1964,1963,1962
Queste statistiche in altri paesi:
AfghanistanAlbaniaAlgeriaAndorraAngolaAntigua and BarbudaArab WorldArgentinaArmeniaArubaAustraliaAustriaAzerbaijanBahamas, TheBahrainBangladeshBarbadosBelarusBelgiumBelizeBeninBermudaBhutanBoliviaBosnia and HerzegovinaBotswanaBrazilBrunei DarussalamBulgariaBurkina FasoBurundiCabo VerdeCambodiaCameroonCanadaCaribbean small statesCayman IslandsCentral African RepublicCentral Europe and the BalticsChadChannel IslandsChileChinaColombiaComorosCongo, Dem. Rep.Congo, Rep.Costa RicaCote d'IvoireCroatiaCubaCyprusCzech RepublicDenmarkDjiboutiDominicaDominican RepublicEarly-demographic dividendEast Asia & PacificEast Asia & Pacific (excluding high income)East Asia & Pacific (IDA & IBRD countries)EcuadorEgypt, Arab Rep.El SalvadorEquatorial GuineaEritreaEstoniaEthiopiaEuro areaEurope & Central AsiaEurope & Central Asia (excluding high income)Europe & Central Asia (IDA & IBRD countries)European UnionFijiFinlandFragile and conflict affected situationsFranceFrench PolynesiaGabonGambia, TheGeorgiaGermanyGhanaGreeceGreenlandGrenadaGuatemalaGuineaGuinea-BissauGuyanaHaitiHeavily indebted poor countries (HIPC)High incomeHondurasHong Kong SAR, ChinaHungaryIBRD onlyIcelandIDA & IBRD totalIDA blendIDA onlyIDA totalIndiaIndonesiaIran, Islamic Rep.IraqIrelandIsle of ManIsraelItalyJamaicaJapanJordanKazakhstanKenyaKiribatiKorea, Rep.KosovoKuwaitKyrgyz RepublicLao PDRLate-demographic dividendLatin America & Caribbean Latin America & Caribbean (excluding high income)Latin America & the Caribbean (IDA & IBRD countries)LatviaLeast developed countries: UN classificationLebanonLesothoLiberiaLibyaLiechtensteinLithuaniaLow & middle incomeLow incomeLower middle incomeLuxembourgMacao SAR, ChinaMacedonia, FYRMadagascarMalawiMalaysiaMaldivesMaliMaltaMarshall IslandsMauritaniaMauritiusMexicoMicronesia, Fed. Sts.Middle East & North AfricaMiddle East & North Africa (excluding high income)Middle East & North Africa (IDA & IBRD countries)Middle incomeMoldovaMonacoMongoliaMontenegroMoroccoMozambiqueMyanmarNamibiaNauruNepalNetherlandsNew CaledoniaNew ZealandNicaraguaNigerNigeriaNorth AmericaNorwayOECD membersOmanOther small statesPacific island small statesPakistanPalauPanamaPapua New GuineaParaguayPeruPhilippinesPolandPortugalPost-demographic dividendPre-demographic dividendPuerto RicoQatarRomaniaRussian FederationRwandaSamoaSan MarinoSao Tome and PrincipeSaudi ArabiaSenegalSerbiaSeychellesSierra LeoneSingaporeSlovak RepublicSloveniaSmall statesSolomon IslandsSomaliaSouth AfricaSouth AsiaSouth Asia (IDA & IBRD)South SudanSpainSri LankaSt. Kitts and NevisSt. LuciaSt. Vincent and the GrenadinesSub-Saharan Africa Sub-Saharan Africa (excluding high income)Sub-Saharan Africa (IDA & IBRD countries)SudanSurinameSwazilandSwedenSwitzerlandSyrian Arab RepublicTajikistanTanzaniaThailandTimor-LesteTogoTongaTrinidad and TobagoTunisiaTurkeyTurkmenistanTuvaluUgandaUkraineUnited Arab EmiratesUnited KingdomUnited StatesUpper middle incomeUruguayUzbekistanVanuatuVenezuela, RBVietnamVirgin Islands (U.S.)West Bank and GazaWorldYemen, Rep.ZambiaZimbabwe Linea del tempo:
Questa scala temporale mostra un grafico dal 1962 anno al 2016 anno. Liberia. I dati fino ad 1961 anno non disponibili. Il numero di osservazioni attuali secondo i date: 55.
La fonte (nome):
Indicatori dello sviluppo mondiale
La fonte (organizzazione):
World Bank national accounts data, and OECD National Accounts data files.
Categorie:
Economy & Growth
sono stati aggiornati
23 apr 2017 anni
Indicatori delle variazioni dei valori per anni
Minima:
-51.031
1 gen 1991 anni
Massimo:
106.28
1 gen 1998 anni
Alla data di osservazione
Valore
Variazione assoluta
La variazione rispetto al valore precedente
1 gen 1962 anni
2.44
+2.44
0.0%
1 gen 1963 anni
1.345
-1.095
-44.89%
1 gen 1964 anni
2.274
+0.93
69.15%
1 gen 1965 anni
5.152
+2.878
126.51%
1 gen 1966 anni
4.794
-0.358
-6.95%
1 gen 1967 anni
7.703
+2.909
60.68%
1 gen 1968 anni
6.746
-0.957
-12.42%
1 gen 1969 anni
4.769
-1.977
-29.31%
1 gen 1970 anni
7.288
+2.52
52.83%
1 gen 1971 anni
6.663
-0.625
-8.58%
1 gen 1972 anni
4.905
-1.758
-26.39%
1 gen 1973 anni
4.14
-0.764
-15.58%
1 gen 1974 anni
-2.256
-6.396
-154.49%
1 gen 1975 anni
4.753
+7.009
-310.69%
1 gen 1976 anni
-3.469
-8.222
-172.97%
1 gen 1977 anni
5.311
+8.779
-253.11%
1 gen 1978 anni
1.588
-3.723
-70.1%
1 gen 1979 anni
4.816
+3.228
203.29%
1 gen 1980 anni
3.265
-1.551
-32.21%
1 gen 1981 anni
-4.098
-7.363
-225.53%
1 gen 1982 anni
-2.137
+1.962
-47.86%
1 gen 1983 anni
-2.433
-0.296
13.86%
1 gen 1984 anni
-1.897
+0.536
-22.03%
1 gen 1985 anni
-2.107
-0.21
11.1%
1 gen 1986 anni
-0.843
+1.264
-59.98%
1 gen 1987 anni
-1.679
-0.835
99.05%
1 gen 1988 anni
-1.002
+0.677
-40.33%
1 gen 1989 anni
-2.042
-1.04
103.86%
1 gen 1990 anni
-26.668
-24.627
1.21 Mille.%
1 gen 1991 anni
-51.031
-24.362
91.35%
1 gen 1992 anni
-14.225
+36.806
-72.12%
1 gen 1993 anni
-35.086
-20.86
146.64%
1 gen 1994 anni
-32.975
+2.11
-6.01%
1 gen 1995 anni
-21.762
+11.213
-34.0%
1 gen 1996 anni
-4.266
+17.496
-80.4%
1 gen 1997 anni
12.121
+16.387
-384.12%
1 gen 1998 anni
106.28
+94.159
776.81%
1 gen 1999 anni
30.208
-76.072
-71.58%
1 gen 2000 anni
21.741
-8.467
-28.03%
1 gen 2001 anni
28.616
+6.874
31.62%
1 gen 2002 anni
2.919
-25.697
-89.8%
1 gen 2003 anni
3.763
+0.844
28.92%
1 gen 2004 anni
-30.145
-33.908
-901.15%
1 gen 2005 anni
2.621
+32.766
-108.69%
1 gen 2006 anni
5.282
+2.661
101.56%
1 gen 2007 anni
8.043
+2.761
52.28%
1 gen 2008 anni
9.535
+1.492
18.55%
1 gen 2009 anni
7.147
-2.388
-25.04%
1 gen 2010 anni
5.3
-1.847
-25.84%
1 gen 2011 anni
6.1
+0.8
15.09%
1 gen 2012 anni
8.2
+2.1
34.43%
1 gen 2013 anni
7.994
-0.206
-2.51%
1 gen 2014 anni
8.704
+0.709
8.87%
1 gen 2015 anni
0.701
-8.003
-91.94%
1 gen 2016 anni
0.0
-0.701
-100.0%
Classificazione dei paesi secondo i statistiche attuali per anni


Commenti: