29
/it/
it
AIzaSyAYiBZKx7MnpbEhh9jyipgxe19OcubqV5w
April 1, 2024
47340
Lower middle income
LMC
false
2
1
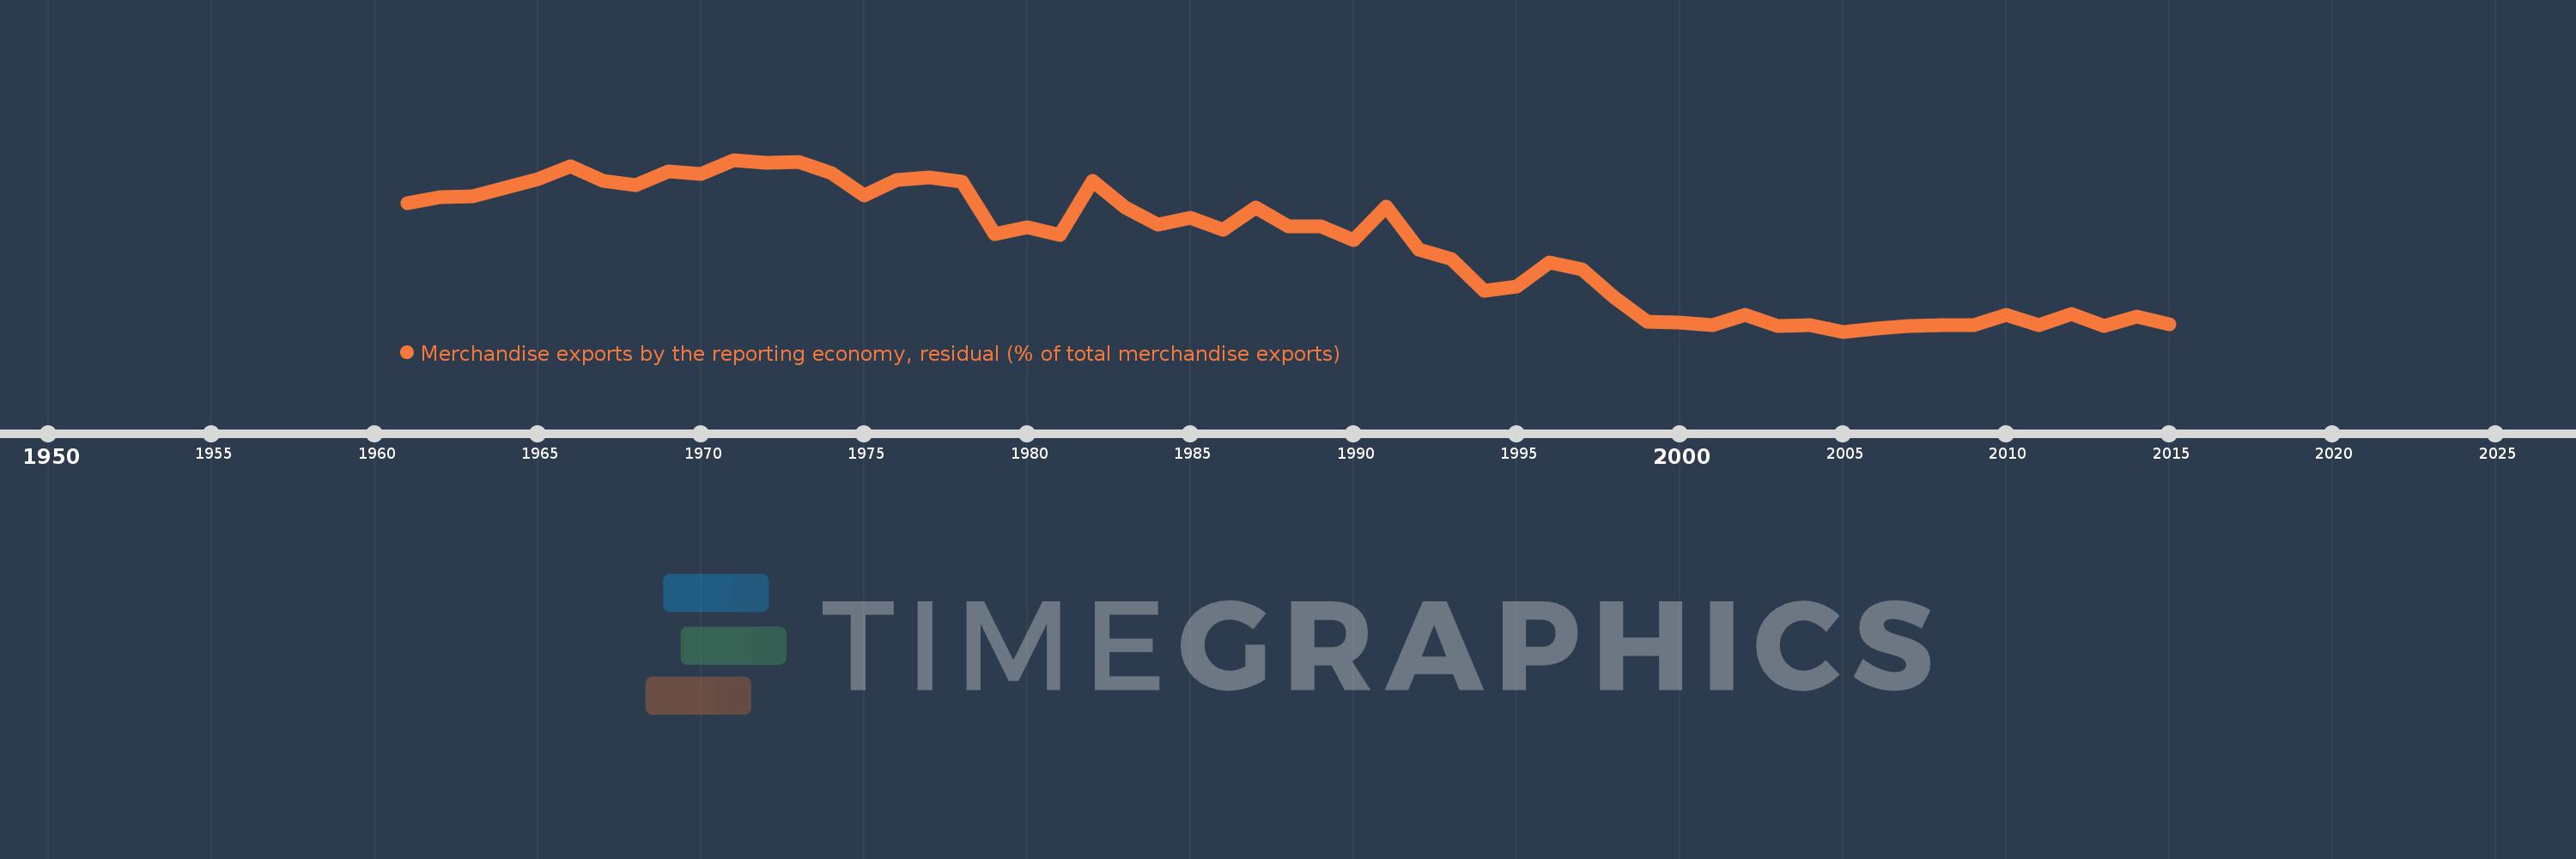
Merchandise exports by the reporting economy, residual (% of total merchandise exports)
2015,2014,2013,2012,2011,2010,2009,2008,2007,2006,2005,2004,2003,2002,2001,2000,1999,1998,1997,1996,1995,1994,1993,1992,1991,1990,1989,1988,1987,1986,1985,1984,1983,1982,1981,1980,1979,1978,1977,1976,1975,1974,1973,1972,1971,1970,1969,1968,1967,1966,1965,1964,1963,1962,1961
Queste statistiche in altri paesi:
AfghanistanAlbaniaAlgeriaAmerican SamoaAngolaAntigua and BarbudaArab WorldArgentinaArmeniaArubaAustraliaAustriaAzerbaijanBahamas, TheBahrainBangladeshBarbadosBelarusBelgiumBelizeBeninBermudaBoliviaBosnia and HerzegovinaBrazilBrunei DarussalamBulgariaBurkina FasoBurundiCabo VerdeCambodiaCameroonCanadaCaribbean small statesCentral African RepublicCentral Europe and the BalticsChadChileChinaColombiaComorosCongo, Dem. Rep.Congo, Rep.Costa RicaCote d'IvoireCroatiaCubaCyprusCzech RepublicDenmarkDjiboutiDominicaDominican RepublicEarly-demographic dividendEast Asia & PacificEast Asia & Pacific (excluding high income)East Asia & Pacific (IDA & IBRD countries)EcuadorEgypt, Arab Rep.El SalvadorEquatorial GuineaEstoniaEthiopiaEuro areaEurope & Central AsiaEurope & Central Asia (excluding high income)Europe & Central Asia (IDA & IBRD countries)European UnionFaroe IslandsFijiFinlandFragile and conflict affected situationsFranceFrench PolynesiaGabonGambia, TheGeorgiaGermanyGhanaGibraltarGreeceGreenlandGrenadaGuamGuatemalaGuineaGuinea-BissauGuyanaHaitiHeavily indebted poor countries (HIPC)High incomeHondurasHong Kong SAR, ChinaHungaryIBRD onlyIcelandIDA & IBRD totalIDA blendIDA onlyIDA totalIndiaIndonesiaIran, Islamic Rep.IraqIrelandIsraelItalyJamaicaJapanJordanKazakhstanKenyaKiribatiKorea, Dem. People’s Rep.Korea, Rep.KosovoKuwaitKyrgyz RepublicLao PDRLate-demographic dividendLatin America & Caribbean Latin America & Caribbean (excluding high income)Latin America & the Caribbean (IDA & IBRD countries)LatviaLeast developed countries: UN classificationLebanonLiberiaLibyaLithuaniaLow & middle incomeLow incomeLower middle incomeLuxembourgMacao SAR, ChinaMacedonia, FYRMadagascarMalawiMalaysiaMaldivesMaliMaltaMauritaniaMauritiusMexicoMiddle East & North AfricaMiddle East & North Africa (excluding high income)Middle East & North Africa (IDA & IBRD countries)Middle incomeMoldovaMongoliaMontenegroMoroccoMozambiqueMyanmarNauruNepalNetherlandsNew CaledoniaNew ZealandNicaraguaNigerNigeriaNorth AmericaNorwayOECD membersOmanOther small statesPacific island small statesPakistanPanamaPapua New GuineaParaguayPeruPhilippinesPolandPortugalPost-demographic dividendPre-demographic dividendQatarRomaniaRussian FederationRwandaSamoaSao Tome and PrincipeSaudi ArabiaSenegalSerbiaSeychellesSierra LeoneSingaporeSlovak RepublicSloveniaSmall statesSolomon IslandsSomaliaSouth AfricaSouth AsiaSouth Asia (IDA & IBRD)SpainSri LankaSt. Kitts and NevisSt. LuciaSt. Vincent and the GrenadinesSub-Saharan Africa Sub-Saharan Africa (excluding high income)Sub-Saharan Africa (IDA & IBRD countries)SudanSurinameSwedenSwitzerlandSyrian Arab RepublicTajikistanTanzaniaThailandTogoTongaTrinidad and TobagoTunisiaTurkeyTurkmenistanTuvaluUgandaUkraineUnited Arab EmiratesUnited KingdomUnited StatesUpper middle incomeUruguayUzbekistanVanuatuVenezuela, RBVietnamWorldYemen, Rep.ZambiaZimbabwe Linea del tempo:
Questa scala temporale mostra un grafico dal 1961 anno al 2015 anno. Lower middle income. I dati fino ad 1960 anno non disponibili. Il numero di osservazioni attuali secondo i date: 55.
La fonte (nome):
Indicatori dello sviluppo mondiale
La fonte (organizzazione):
World Bank staff estimates based data from International Monetary Fund's Direction of Trade database.
Categorie:
Private Sector, Trade
sono stati aggiornati
23 apr 2017 anni
Indicatori delle variazioni dei valori per anni
Minima:
2.224
1 gen 2005 anni
Massimo:
14.811
1 gen 1971 anni
Alla data di osservazione
Valore
Variazione assoluta
La variazione rispetto al valore precedente
1 gen 1961 anni
11.636
+11.636
0.0%
1 gen 1962 anni
12.066
+0.431
3.7%
1 gen 1963 anni
12.12
+0.054
0.44%
1 gen 1964 anni
12.784
+0.664
5.48%
1 gen 1965 anni
13.379
+0.595
4.65%
1 gen 1966 anni
14.345
+0.967
7.22%
1 gen 1967 anni
13.254
-1.091
-7.6%
1 gen 1968 anni
12.983
-0.271
-2.05%
1 gen 1969 anni
13.977
+0.994
7.66%
1 gen 1970 anni
13.773
-0.204
-1.46%
1 gen 1971 anni
14.811
+1.037
7.53%
1 gen 1972 anni
14.57
-0.241
-1.63%
1 gen 1973 anni
14.638
+0.068
0.47%
1 gen 1974 anni
13.821
-0.817
-5.58%
1 gen 1975 anni
12.175
-1.646
-11.91%
1 gen 1976 anni
13.345
+1.17
9.61%
1 gen 1977 anni
13.538
+0.193
1.45%
1 gen 1978 anni
13.23
-0.308
-2.27%
1 gen 1979 anni
9.38
-3.85
-29.1%
1 gen 1980 anni
9.863
+0.482
5.14%
1 gen 1981 anni
9.296
-0.567
-5.74%
1 gen 1982 anni
13.26
+3.964
42.64%
1 gen 1983 anni
11.323
-1.937
-14.61%
1 gen 1984 anni
10.066
-1.257
-11.1%
1 gen 1985 anni
10.577
+0.511
5.08%
1 gen 1986 anni
9.655
-0.922
-8.72%
1 gen 1987 anni
11.311
+1.656
17.15%
1 gen 1988 anni
9.954
-1.358
-12.0%
1 gen 1989 anni
9.951
-0.003
-0.03%
1 gen 1990 anni
8.903
-1.048
-10.53%
1 gen 1991 anni
11.367
+2.464
27.68%
1 gen 1992 anni
8.231
-3.136
-27.59%
1 gen 1993 anni
7.569
-0.662
-8.04%
1 gen 1994 anni
5.205
-2.364
-31.23%
1 gen 1995 anni
5.545
+0.34
6.54%
1 gen 1996 anni
7.27
+1.724
31.09%
1 gen 1997 anni
6.797
-0.473
-6.5%
1 gen 1998 anni
4.734
-2.063
-30.35%
1 gen 1999 anni
2.956
-1.778
-37.55%
1 gen 2000 anni
2.868
-0.088
-2.97%
1 gen 2001 anni
2.701
-0.167
-5.84%
1 gen 2002 anni
3.471
+0.77
28.5%
1 gen 2003 anni
2.657
-0.813
-23.44%
1 gen 2004 anni
2.726
+0.069
2.59%
1 gen 2005 anni
2.224
-0.502
-18.4%
1 gen 2006 anni
2.439
+0.215
9.65%
1 gen 2007 anni
2.616
+0.177
7.25%
1 gen 2008 anni
2.722
+0.106
4.05%
1 gen 2009 anni
2.706
-0.016
-0.59%
1 gen 2010 anni
3.461
+0.756
27.93%
1 gen 2011 anni
2.673
-0.788
-22.77%
1 gen 2012 anni
3.498
+0.825
30.87%
1 gen 2013 anni
2.658
-0.84
-24.02%
1 gen 2014 anni
3.353
+0.695
26.14%
1 gen 2015 anni
2.739
-0.614
-18.31%
Classificazione dei paesi secondo i statistiche attuali per anni


Commenti: