29
/it/
it
AIzaSyAYiBZKx7MnpbEhh9jyipgxe19OcubqV5w
April 1, 2024
25077
Caribbean small states
CSS
false
2
1
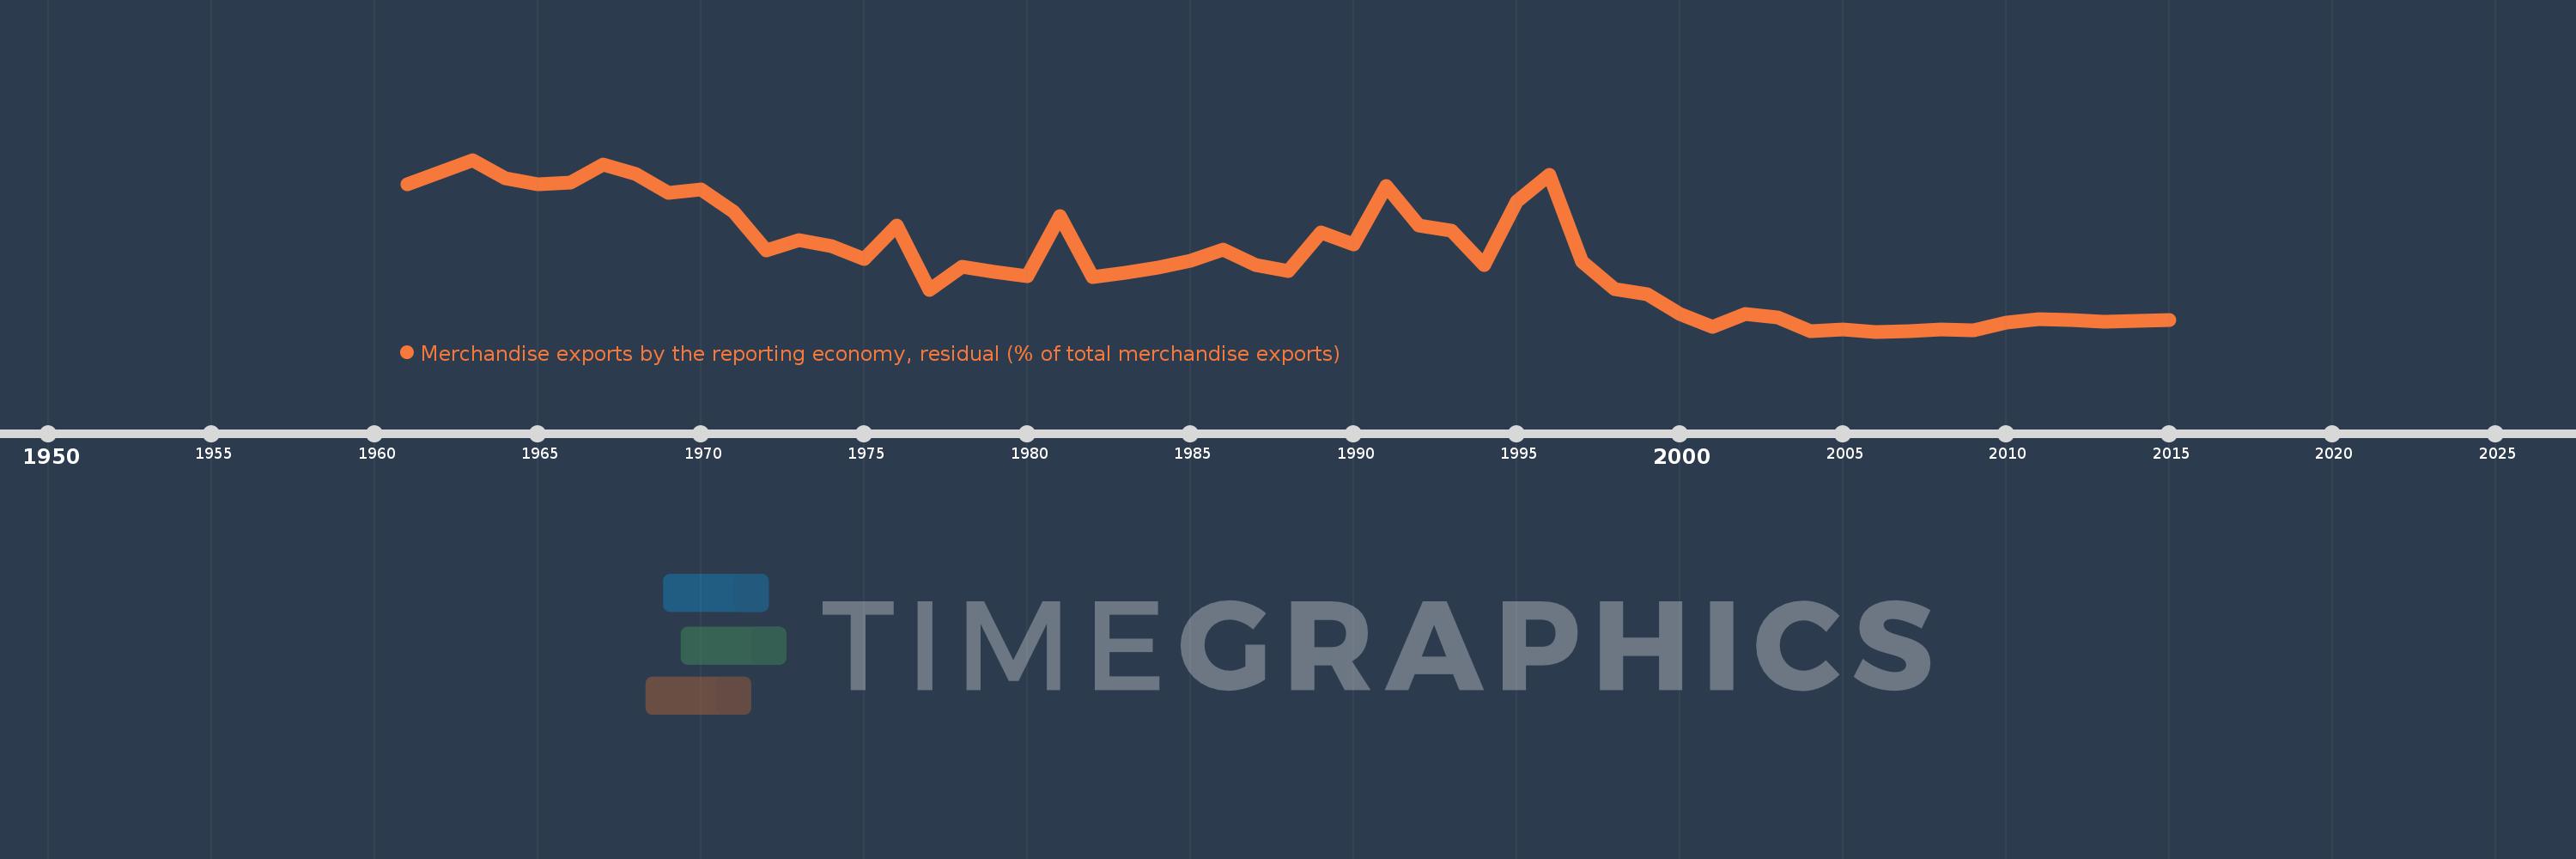
Merchandise exports by the reporting economy, residual (% of total merchandise exports)
2015,2014,2013,2012,2011,2010,2009,2008,2007,2006,2005,2004,2003,2002,2001,2000,1999,1998,1997,1996,1995,1994,1993,1992,1991,1990,1989,1988,1987,1986,1985,1984,1983,1982,1981,1980,1979,1978,1977,1976,1975,1974,1973,1972,1971,1970,1969,1968,1967,1966,1965,1964,1963,1962,1961
Queste statistiche in altri paesi:
AfghanistanAlbaniaAlgeriaAmerican SamoaAngolaAntigua and BarbudaArab WorldArgentinaArmeniaArubaAustraliaAustriaAzerbaijanBahamas, TheBahrainBangladeshBarbadosBelarusBelgiumBelizeBeninBermudaBoliviaBosnia and HerzegovinaBrazilBrunei DarussalamBulgariaBurkina FasoBurundiCabo VerdeCambodiaCameroonCanadaCaribbean small statesCentral African RepublicCentral Europe and the BalticsChadChileChinaColombiaComorosCongo, Dem. Rep.Congo, Rep.Costa RicaCote d'IvoireCroatiaCubaCyprusCzech RepublicDenmarkDjiboutiDominicaDominican RepublicEarly-demographic dividendEast Asia & PacificEast Asia & Pacific (excluding high income)East Asia & Pacific (IDA & IBRD countries)EcuadorEgypt, Arab Rep.El SalvadorEquatorial GuineaEstoniaEthiopiaEuro areaEurope & Central AsiaEurope & Central Asia (excluding high income)Europe & Central Asia (IDA & IBRD countries)European UnionFaroe IslandsFijiFinlandFragile and conflict affected situationsFranceFrench PolynesiaGabonGambia, TheGeorgiaGermanyGhanaGibraltarGreeceGreenlandGrenadaGuamGuatemalaGuineaGuinea-BissauGuyanaHaitiHeavily indebted poor countries (HIPC)High incomeHondurasHong Kong SAR, ChinaHungaryIBRD onlyIcelandIDA & IBRD totalIDA blendIDA onlyIDA totalIndiaIndonesiaIran, Islamic Rep.IraqIrelandIsraelItalyJamaicaJapanJordanKazakhstanKenyaKiribatiKorea, Dem. People’s Rep.Korea, Rep.KosovoKuwaitKyrgyz RepublicLao PDRLate-demographic dividendLatin America & Caribbean Latin America & Caribbean (excluding high income)Latin America & the Caribbean (IDA & IBRD countries)LatviaLeast developed countries: UN classificationLebanonLiberiaLibyaLithuaniaLow & middle incomeLow incomeLower middle incomeLuxembourgMacao SAR, ChinaMacedonia, FYRMadagascarMalawiMalaysiaMaldivesMaliMaltaMauritaniaMauritiusMexicoMiddle East & North AfricaMiddle East & North Africa (excluding high income)Middle East & North Africa (IDA & IBRD countries)Middle incomeMoldovaMongoliaMontenegroMoroccoMozambiqueMyanmarNauruNepalNetherlandsNew CaledoniaNew ZealandNicaraguaNigerNigeriaNorth AmericaNorwayOECD membersOmanOther small statesPacific island small statesPakistanPanamaPapua New GuineaParaguayPeruPhilippinesPolandPortugalPost-demographic dividendPre-demographic dividendQatarRomaniaRussian FederationRwandaSamoaSao Tome and PrincipeSaudi ArabiaSenegalSerbiaSeychellesSierra LeoneSingaporeSlovak RepublicSloveniaSmall statesSolomon IslandsSomaliaSouth AfricaSouth AsiaSouth Asia (IDA & IBRD)SpainSri LankaSt. Kitts and NevisSt. LuciaSt. Vincent and the GrenadinesSub-Saharan Africa Sub-Saharan Africa (excluding high income)Sub-Saharan Africa (IDA & IBRD countries)SudanSurinameSwedenSwitzerlandSyrian Arab RepublicTajikistanTanzaniaThailandTogoTongaTrinidad and TobagoTunisiaTurkeyTurkmenistanTuvaluUgandaUkraineUnited Arab EmiratesUnited KingdomUnited StatesUpper middle incomeUruguayUzbekistanVanuatuVenezuela, RBVietnamWorldYemen, Rep.ZambiaZimbabwe Linea del tempo:
Questa scala temporale mostra un grafico dal 1961 anno al 2015 anno. Caribbean small states. I dati fino ad 1960 anno non disponibili. Il numero di osservazioni attuali secondo i date: 55.
La fonte (nome):
Indicatori dello sviluppo mondiale
La fonte (organizzazione):
World Bank staff estimates based data from International Monetary Fund's Direction of Trade database.
Categorie:
Private Sector, Trade
sono stati aggiornati
23 apr 2017 anni
Indicatori delle variazioni dei valori per anni
Minima:
1.3
1 gen 2006 anni
Massimo:
14.159
1 gen 1963 anni
Alla data di osservazione
Valore
Variazione assoluta
La variazione rispetto al valore precedente
1 gen 1961 anni
12.343
+12.343
0.0%
1 gen 1962 anni
13.243
+0.9
7.29%
1 gen 1963 anni
14.159
+0.916
6.91%
1 gen 1964 anni
12.803
-1.356
-9.58%
1 gen 1965 anni
12.352
-0.451
-3.52%
1 gen 1966 anni
12.452
+0.1
0.81%
1 gen 1967 anni
13.788
+1.336
10.73%
1 gen 1968 anni
13.071
-0.717
-5.2%
1 gen 1969 anni
11.697
-1.373
-10.51%
1 gen 1970 anni
11.969
+0.271
2.32%
1 gen 1971 anni
10.266
-1.703
-14.23%
1 gen 1972 anni
7.349
-2.917
-28.41%
1 gen 1973 anni
8.173
+0.824
11.22%
1 gen 1974 anni
7.696
-0.477
-5.84%
1 gen 1975 anni
6.76
-0.936
-12.16%
1 gen 1976 anni
9.213
+2.453
36.29%
1 gen 1977 anni
4.438
-4.775
-51.83%
1 gen 1978 anni
6.164
+1.726
38.89%
1 gen 1979 anni
5.783
-0.381
-6.18%
1 gen 1980 anni
5.441
-0.342
-5.91%
1 gen 1981 anni
9.964
+4.522
83.11%
1 gen 1982 anni
5.405
-4.559
-45.76%
1 gen 1983 anni
5.73
+0.326
6.03%
1 gen 1984 anni
6.088
+0.357
6.23%
1 gen 1985 anni
6.6
+0.512
8.41%
1 gen 1986 anni
7.454
+0.854
12.94%
1 gen 1987 anni
6.257
-1.197
-16.06%
1 gen 1988 anni
5.808
-0.449
-7.17%
1 gen 1989 anni
8.731
+2.923
50.32%
1 gen 1990 anni
7.845
-0.885
-10.14%
1 gen 1991 anni
12.169
+4.324
55.12%
1 gen 1992 anni
9.216
-2.953
-24.27%
1 gen 1993 anni
8.882
-0.334
-3.63%
1 gen 1994 anni
6.27
-2.611
-29.4%
1 gen 1995 anni
11.054
+4.784
76.29%
1 gen 1996 anni
13.051
+1.997
18.06%
1 gen 1997 anni
6.528
-6.523
-49.98%
1 gen 1998 anni
4.49
-2.037
-31.21%
1 gen 1999 anni
4.081
-0.41
-9.12%
1 gen 2000 anni
2.637
-1.444
-35.37%
1 gen 2001 anni
1.677
-0.96
-36.41%
1 gen 2002 anni
2.634
+0.956
57.02%
1 gen 2003 anni
2.35
-0.284
-10.78%
1 gen 2004 anni
1.364
-0.985
-41.94%
1 gen 2005 anni
1.444
+0.08
5.87%
1 gen 2006 anni
1.3
-0.145
-10.03%
1 gen 2007 anni
1.325
+0.026
1.98%
1 gen 2008 anni
1.487
+0.162
12.19%
1 gen 2009 anni
1.403
-0.084
-5.66%
1 gen 2010 anni
1.967
+0.565
40.26%
1 gen 2011 anni
2.25
+0.283
14.38%
1 gen 2012 anni
2.145
-0.105
-4.68%
1 gen 2013 anni
2.022
-0.123
-5.72%
1 gen 2014 anni
2.094
+0.072
3.57%
1 gen 2015 anni
2.147
+0.053
2.53%
Classificazione dei paesi secondo i statistiche attuali per anni


Commenti: