29
/it/
it
AIzaSyAYiBZKx7MnpbEhh9jyipgxe19OcubqV5w
April 1, 2024
156271
Indonesia
IDN
true
2
1
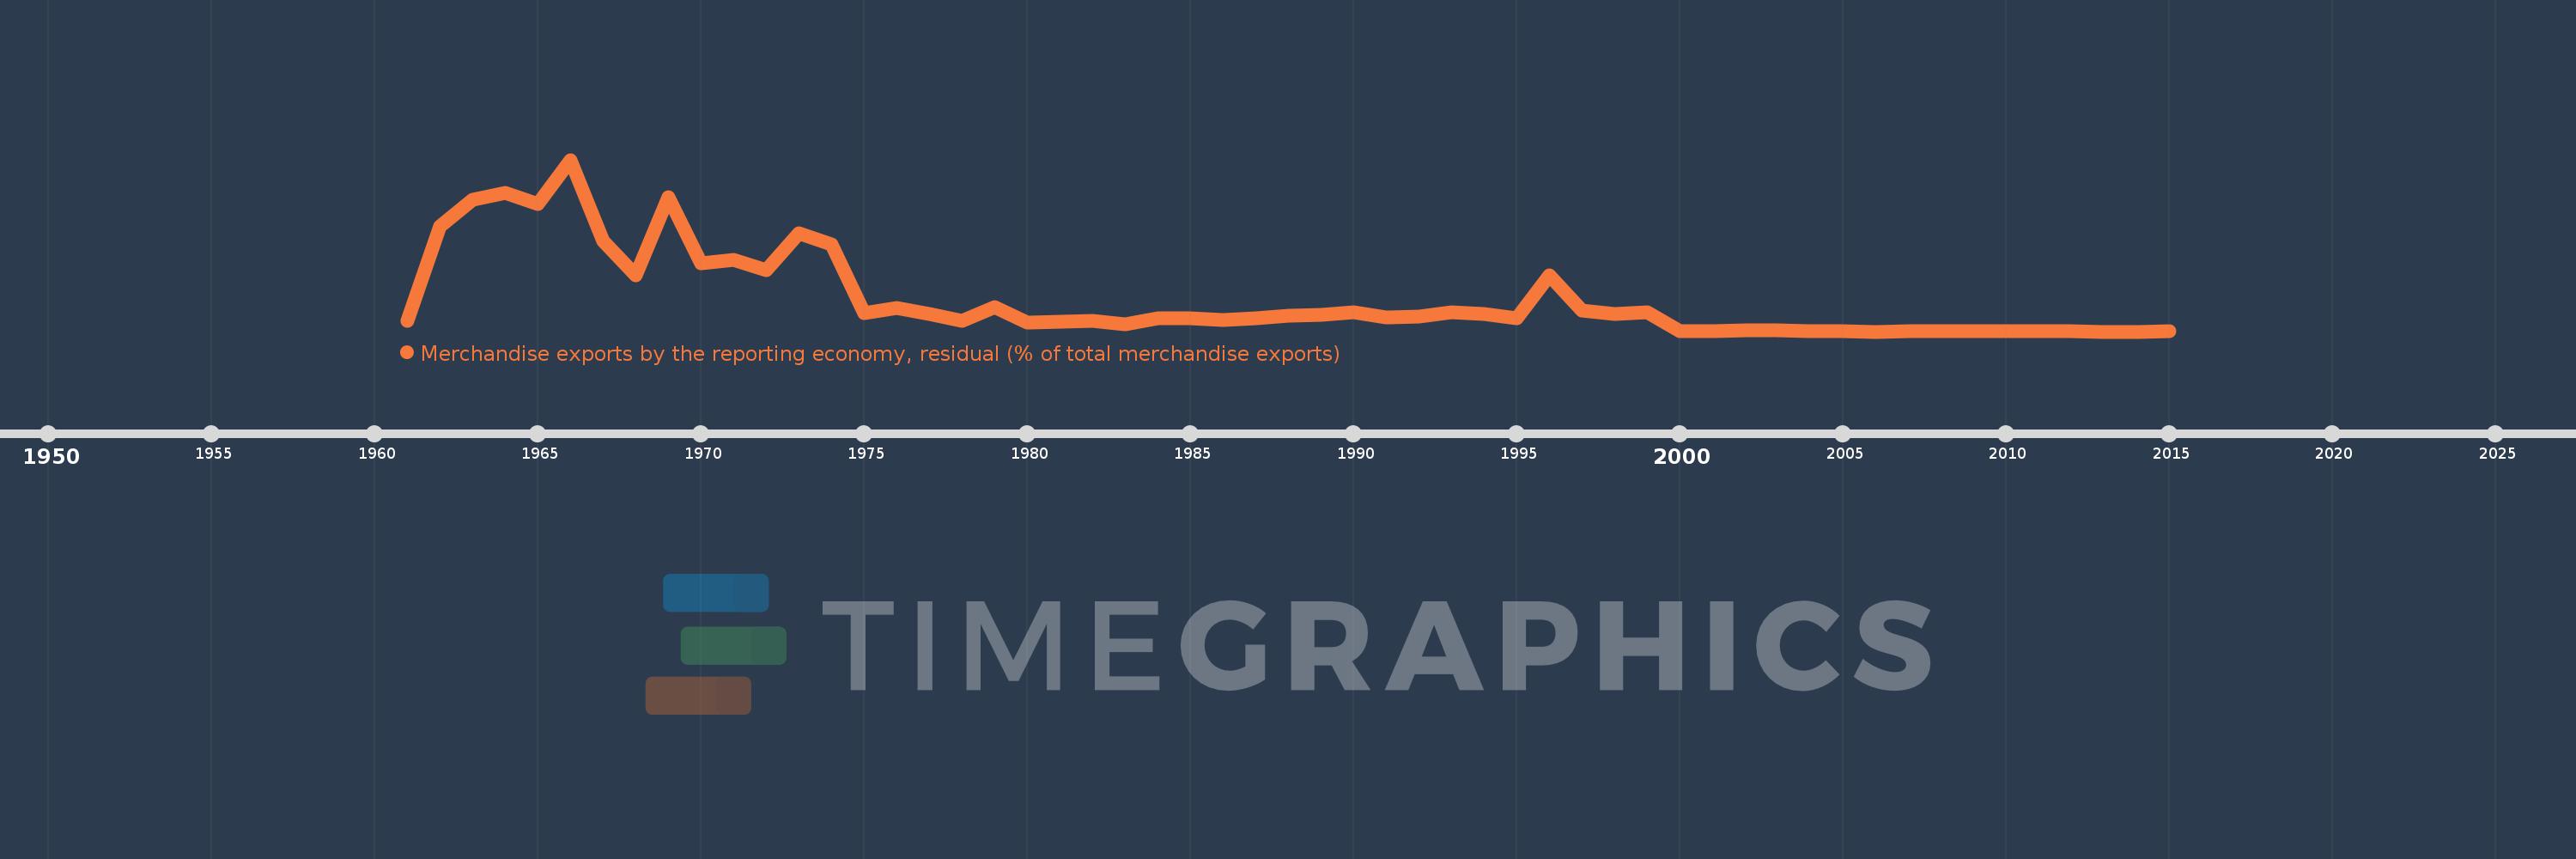
Merchandise exports by the reporting economy, residual (% of total merchandise exports)
2015,2014,2013,2012,2011,2010,2009,2008,2007,2006,2005,2004,2003,2002,2001,2000,1999,1998,1997,1996,1995,1994,1993,1992,1991,1990,1989,1988,1987,1986,1985,1984,1983,1982,1981,1980,1979,1978,1977,1976,1975,1974,1973,1972,1971,1970,1969,1968,1967,1966,1965,1964,1963,1962,1961
Queste statistiche in altri paesi:
AfghanistanAlbaniaAlgeriaAmerican SamoaAngolaAntigua and BarbudaArab WorldArgentinaArmeniaArubaAustraliaAustriaAzerbaijanBahamas, TheBahrainBangladeshBarbadosBelarusBelgiumBelizeBeninBermudaBoliviaBosnia and HerzegovinaBrazilBrunei DarussalamBulgariaBurkina FasoBurundiCabo VerdeCambodiaCameroonCanadaCaribbean small statesCentral African RepublicCentral Europe and the BalticsChadChileChinaColombiaComorosCongo, Dem. Rep.Congo, Rep.Costa RicaCote d'IvoireCroatiaCubaCyprusCzech RepublicDenmarkDjiboutiDominicaDominican RepublicEarly-demographic dividendEast Asia & PacificEast Asia & Pacific (excluding high income)East Asia & Pacific (IDA & IBRD countries)EcuadorEgypt, Arab Rep.El SalvadorEquatorial GuineaEstoniaEthiopiaEuro areaEurope & Central AsiaEurope & Central Asia (excluding high income)Europe & Central Asia (IDA & IBRD countries)European UnionFaroe IslandsFijiFinlandFragile and conflict affected situationsFranceFrench PolynesiaGabonGambia, TheGeorgiaGermanyGhanaGibraltarGreeceGreenlandGrenadaGuamGuatemalaGuineaGuinea-BissauGuyanaHaitiHeavily indebted poor countries (HIPC)High incomeHondurasHong Kong SAR, ChinaHungaryIBRD onlyIcelandIDA & IBRD totalIDA blendIDA onlyIDA totalIndiaIndonesiaIran, Islamic Rep.IraqIrelandIsraelItalyJamaicaJapanJordanKazakhstanKenyaKiribatiKorea, Dem. People’s Rep.Korea, Rep.KosovoKuwaitKyrgyz RepublicLao PDRLate-demographic dividendLatin America & Caribbean Latin America & Caribbean (excluding high income)Latin America & the Caribbean (IDA & IBRD countries)LatviaLeast developed countries: UN classificationLebanonLiberiaLibyaLithuaniaLow & middle incomeLow incomeLower middle incomeLuxembourgMacao SAR, ChinaMacedonia, FYRMadagascarMalawiMalaysiaMaldivesMaliMaltaMauritaniaMauritiusMexicoMiddle East & North AfricaMiddle East & North Africa (excluding high income)Middle East & North Africa (IDA & IBRD countries)Middle incomeMoldovaMongoliaMontenegroMoroccoMozambiqueMyanmarNauruNepalNetherlandsNew CaledoniaNew ZealandNicaraguaNigerNigeriaNorth AmericaNorwayOECD membersOmanOther small statesPacific island small statesPakistanPanamaPapua New GuineaParaguayPeruPhilippinesPolandPortugalPost-demographic dividendPre-demographic dividendQatarRomaniaRussian FederationRwandaSamoaSao Tome and PrincipeSaudi ArabiaSenegalSerbiaSeychellesSierra LeoneSingaporeSlovak RepublicSloveniaSmall statesSolomon IslandsSomaliaSouth AfricaSouth AsiaSouth Asia (IDA & IBRD)SpainSri LankaSt. Kitts and NevisSt. LuciaSt. Vincent and the GrenadinesSub-Saharan Africa Sub-Saharan Africa (excluding high income)Sub-Saharan Africa (IDA & IBRD countries)SudanSurinameSwedenSwitzerlandSyrian Arab RepublicTajikistanTanzaniaThailandTogoTongaTrinidad and TobagoTunisiaTurkeyTurkmenistanTuvaluUgandaUkraineUnited Arab EmiratesUnited KingdomUnited StatesUpper middle incomeUruguayUzbekistanVanuatuVenezuela, RBVietnamWorldYemen, Rep.ZambiaZimbabwe Linea del tempo:
Questa scala temporale mostra un grafico dal 1961 anno al 2015 anno. Indonesia. I dati fino ad 1960 anno non disponibili. Il numero di osservazioni attuali secondo i date: 55.
La fonte (nome):
Indicatori dello sviluppo mondiale
La fonte (organizzazione):
World Bank staff estimates based data from International Monetary Fund's Direction of Trade database.
Categorie:
Private Sector, Trade
sono stati aggiornati
23 apr 2017 anni
Indicatori delle variazioni dei valori per anni
Minima:
0.022
1 gen 2006 anni
Massimo:
16.607
1 gen 1966 anni
Alla data di osservazione
Valore
Variazione assoluta
La variazione rispetto al valore precedente
1 gen 1961 anni
1.099
+1.099
0.0%
1 gen 1962 anni
10.182
+9.083
826.55%
1 gen 1963 anni
12.717
+2.535
24.9%
1 gen 1964 anni
13.415
+0.697
5.48%
1 gen 1965 anni
12.32
-1.094
-8.16%
1 gen 1966 anni
16.607
+4.286
34.79%
1 gen 1967 anni
8.79
-7.816
-47.07%
1 gen 1968 anni
5.458
-3.332
-37.91%
1 gen 1969 anni
13.025
+7.568
138.65%
1 gen 1970 anni
6.651
-6.374
-48.94%
1 gen 1971 anni
6.936
+0.285
4.28%
1 gen 1972 anni
5.937
-0.999
-14.4%
1 gen 1973 anni
9.492
+3.555
59.88%
1 gen 1974 anni
8.408
-1.083
-11.41%
1 gen 1975 anni
1.767
-6.641
-78.98%
1 gen 1976 anni
2.287
+0.52
29.41%
1 gen 1977 anni
1.698
-0.589
-25.75%
1 gen 1978 anni
1.022
-0.676
-39.83%
1 gen 1979 anni
2.397
+1.376
134.66%
1 gen 1980 anni
0.865
-1.532
-63.9%
1 gen 1981 anni
0.951
+0.086
9.95%
1 gen 1982 anni
1.046
+0.094
9.92%
1 gen 1983 anni
0.686
-0.36
-34.38%
1 gen 1984 anni
1.273
+0.587
85.56%
1 gen 1985 anni
1.294
+0.02
1.6%
1 gen 1986 anni
1.112
-0.182
-14.03%
1 gen 1987 anni
1.329
+0.217
19.48%
1 gen 1988 anni
1.523
+0.195
14.65%
1 gen 1989 anni
1.614
+0.09
5.92%
1 gen 1990 anni
1.847
+0.234
14.49%
1 gen 1991 anni
1.408
-0.44
-23.79%
1 gen 1992 anni
1.455
+0.047
3.34%
1 gen 1993 anni
1.853
+0.398
27.37%
1 gen 1994 anni
1.757
-0.096
-5.19%
1 gen 1995 anni
1.28
-0.477
-27.14%
1 gen 1996 anni
5.488
+4.208
328.69%
1 gen 1997 anni
2.064
-3.424
-62.4%
1 gen 1998 anni
1.686
-0.378
-18.32%
1 gen 1999 anni
1.892
+0.207
12.26%
1 gen 2000 anni
0.057
-1.835
-96.99%
1 gen 2001 anni
0.102
+0.045
79.09%
1 gen 2002 anni
0.174
+0.072
70.67%
1 gen 2003 anni
0.135
-0.039
-22.42%
1 gen 2004 anni
0.067
-0.068
-50.6%
1 gen 2005 anni
0.044
-0.023
-34.74%
1 gen 2006 anni
0.022
-0.022
-50.06%
1 gen 2007 anni
0.071
+0.049
225.15%
1 gen 2008 anni
0.058
-0.012
-17.38%
1 gen 2009 anni
0.053
-0.005
-9.35%
1 gen 2010 anni
0.059
+0.006
12.11%
1 gen 2011 anni
0.059
+0.0
0.08%
1 gen 2012 anni
0.046
-0.013
-22.0%
1 gen 2013 anni
0.022
-0.024
-51.78%
1 gen 2014 anni
0.022
-0.001
-2.65%
1 gen 2015 anni
0.028
+0.006
28.14%
Classificazione dei paesi secondo i statistiche attuali per anni


Commenti: