29
/it/
it
AIzaSyAYiBZKx7MnpbEhh9jyipgxe19OcubqV5w
April 1, 2024
282556
Vietnam
VNM
true
2
1
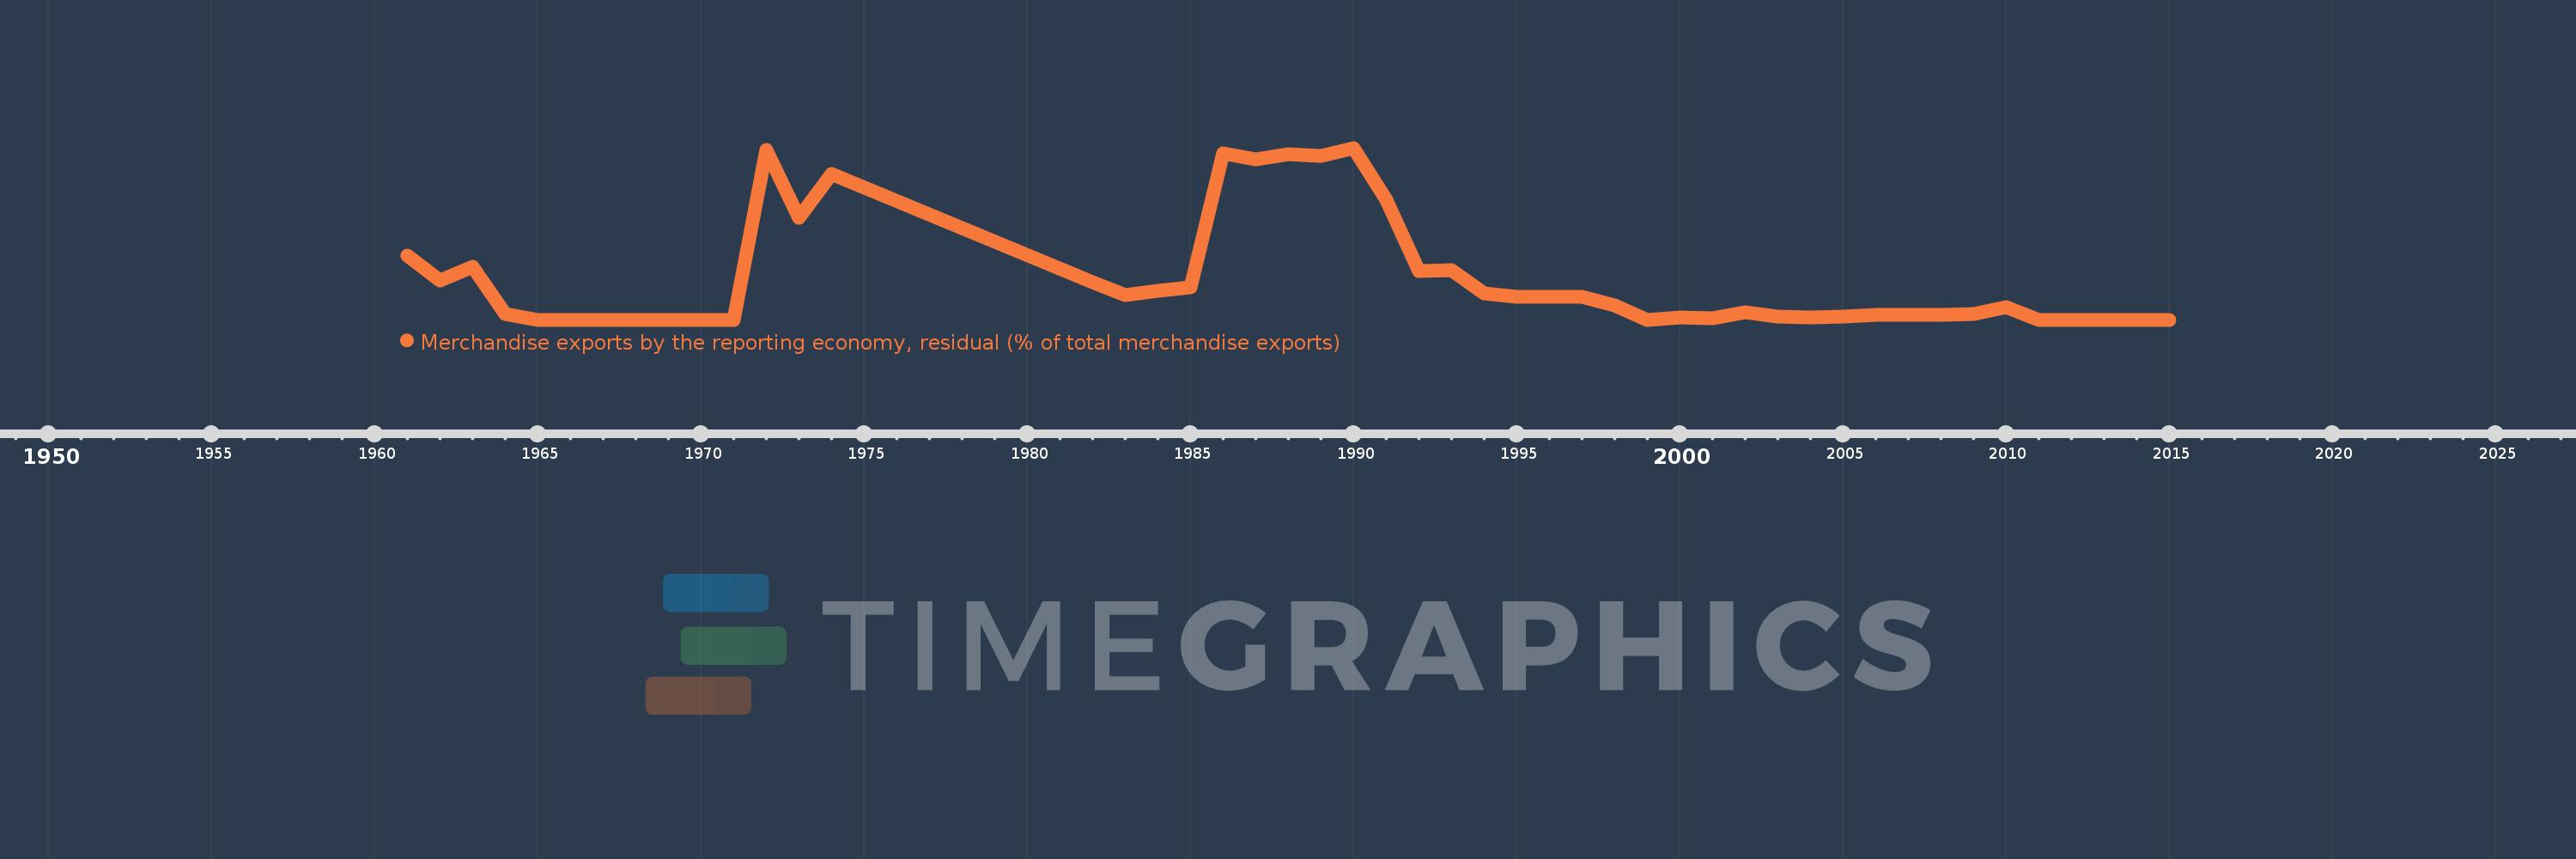
Merchandise exports by the reporting economy, residual (% of total merchandise exports)
2015,2014,2013,2012,2011,2010,2009,2008,2007,2006,2005,2004,2003,2002,2001,2000,1999,1998,1997,1996,1995,1994,1993,1992,1991,1990,1989,1988,1987,1986,1985,1984,1983,1982,1974,1973,1972,1971,1970,1969,1968,1967,1966,1965,1964,1963,1962,1961
Queste statistiche in altri paesi:
AfghanistanAlbaniaAlgeriaAmerican SamoaAngolaAntigua and BarbudaArab WorldArgentinaArmeniaArubaAustraliaAustriaAzerbaijanBahamas, TheBahrainBangladeshBarbadosBelarusBelgiumBelizeBeninBermudaBoliviaBosnia and HerzegovinaBrazilBrunei DarussalamBulgariaBurkina FasoBurundiCabo VerdeCambodiaCameroonCanadaCaribbean small statesCentral African RepublicCentral Europe and the BalticsChadChileChinaColombiaComorosCongo, Dem. Rep.Congo, Rep.Costa RicaCote d'IvoireCroatiaCubaCyprusCzech RepublicDenmarkDjiboutiDominicaDominican RepublicEarly-demographic dividendEast Asia & PacificEast Asia & Pacific (excluding high income)East Asia & Pacific (IDA & IBRD countries)EcuadorEgypt, Arab Rep.El SalvadorEquatorial GuineaEstoniaEthiopiaEuro areaEurope & Central AsiaEurope & Central Asia (excluding high income)Europe & Central Asia (IDA & IBRD countries)European UnionFaroe IslandsFijiFinlandFragile and conflict affected situationsFranceFrench PolynesiaGabonGambia, TheGeorgiaGermanyGhanaGibraltarGreeceGreenlandGrenadaGuamGuatemalaGuineaGuinea-BissauGuyanaHaitiHeavily indebted poor countries (HIPC)High incomeHondurasHong Kong SAR, ChinaHungaryIBRD onlyIcelandIDA & IBRD totalIDA blendIDA onlyIDA totalIndiaIndonesiaIran, Islamic Rep.IraqIrelandIsraelItalyJamaicaJapanJordanKazakhstanKenyaKiribatiKorea, Dem. People’s Rep.Korea, Rep.KosovoKuwaitKyrgyz RepublicLao PDRLate-demographic dividendLatin America & Caribbean Latin America & Caribbean (excluding high income)Latin America & the Caribbean (IDA & IBRD countries)LatviaLeast developed countries: UN classificationLebanonLiberiaLibyaLithuaniaLow & middle incomeLow incomeLower middle incomeLuxembourgMacao SAR, ChinaMacedonia, FYRMadagascarMalawiMalaysiaMaldivesMaliMaltaMauritaniaMauritiusMexicoMiddle East & North AfricaMiddle East & North Africa (excluding high income)Middle East & North Africa (IDA & IBRD countries)Middle incomeMoldovaMongoliaMontenegroMoroccoMozambiqueMyanmarNauruNepalNetherlandsNew CaledoniaNew ZealandNicaraguaNigerNigeriaNorth AmericaNorwayOECD membersOmanOther small statesPacific island small statesPakistanPanamaPapua New GuineaParaguayPeruPhilippinesPolandPortugalPost-demographic dividendPre-demographic dividendQatarRomaniaRussian FederationRwandaSamoaSao Tome and PrincipeSaudi ArabiaSenegalSerbiaSeychellesSierra LeoneSingaporeSlovak RepublicSloveniaSmall statesSolomon IslandsSomaliaSouth AfricaSouth AsiaSouth Asia (IDA & IBRD)SpainSri LankaSt. Kitts and NevisSt. LuciaSt. Vincent and the GrenadinesSub-Saharan Africa Sub-Saharan Africa (excluding high income)Sub-Saharan Africa (IDA & IBRD countries)SudanSurinameSwedenSwitzerlandSyrian Arab RepublicTajikistanTanzaniaThailandTogoTongaTrinidad and TobagoTunisiaTurkeyTurkmenistanTuvaluUgandaUkraineUnited Arab EmiratesUnited KingdomUnited StatesUpper middle incomeUruguayUzbekistanVanuatuVenezuela, RBVietnamWorldYemen, Rep.ZambiaZimbabwe Linea del tempo:
Questa scala temporale mostra un grafico dal 1961 anno al 2015 anno. Vietnam. I dati fino ad 1960 anno non disponibili. Il numero di osservazioni attuali secondo i date: 48.
La fonte (nome):
Indicatori dello sviluppo mondiale
La fonte (organizzazione):
World Bank staff estimates based data from International Monetary Fund's Direction of Trade database.
Categorie:
Private Sector, Trade
sono stati aggiornati
23 apr 2017 anni
Indicatori delle variazioni dei valori per anni
Minima:
0.0
1 gen 2015 anni
Massimo:
68.868
1 gen 1990 anni
Alla data di osservazione
Valore
Variazione assoluta
La variazione rispetto al valore precedente
1 gen 1961 anni
25.59
+25.59
0.0%
1 gen 1962 anni
15.698
-9.892
-38.66%
1 gen 1963 anni
21.26
+5.562
35.43%
1 gen 1964 anni
2.222
-19.038
-89.55%
1 gen 1965 anni
0.0
-2.222
-100.0%
1 gen 1972 anni
67.939
+67.939
%
1 gen 1973 anni
41.04
-26.899
-39.59%
1 gen 1974 anni
58.487
+17.447
42.51%
1 gen 1982 anni
15.104
-43.383
-74.18%
1 gen 1983 anni
9.943
-5.162
-34.17%
1 gen 1984 anni
11.759
+1.816
18.27%
1 gen 1985 anni
12.835
+1.076
9.15%
1 gen 1986 anni
66.854
+54.019
420.87%
1 gen 1987 anni
64.432
-2.422
-3.62%
1 gen 1988 anni
66.267
+1.835
2.85%
1 gen 1989 anni
65.654
-0.613
-0.93%
1 gen 1990 anni
68.868
+3.215
4.9%
1 gen 1991 anni
48.001
-20.867
-30.3%
1 gen 1992 anni
19.398
-28.603
-59.59%
1 gen 1993 anni
19.825
+0.427
2.2%
1 gen 1994 anni
10.471
-9.353
-47.18%
1 gen 1995 anni
9.36
-1.111
-10.61%
1 gen 1996 anni
9.224
-0.136
-1.45%
1 gen 1997 anni
9.353
+0.129
1.4%
1 gen 1998 anni
5.587
-3.766
-40.27%
1 gen 1999 anni
0.025
-5.562
-99.55%
1 gen 2000 anni
1.032
+1.006
3.97 Mille.%
1 gen 2001 anni
0.636
-0.396
-38.39%
1 gen 2002 anni
2.865
+2.23
350.84%
1 gen 2003 anni
1.353
-1.512
-52.79%
1 gen 2004 anni
0.941
-0.411
-30.41%
1 gen 2005 anni
1.19
+0.249
26.41%
1 gen 2006 anni
1.992
+0.802
67.37%
1 gen 2007 anni
1.896
-0.096
-4.8%
1 gen 2008 anni
1.914
+0.017
0.92%
1 gen 2009 anni
2.436
+0.523
27.32%
1 gen 2010 anni
4.91
+2.474
101.53%
1 gen 2011 anni
0.0
-4.91
-100.0%
Classificazione dei paesi secondo i statistiche attuali per anni


Commenti: