29
/it/
it
AIzaSyAYiBZKx7MnpbEhh9jyipgxe19OcubqV5w
April 1, 2024
209543
New Zealand
NZL
true
2
1
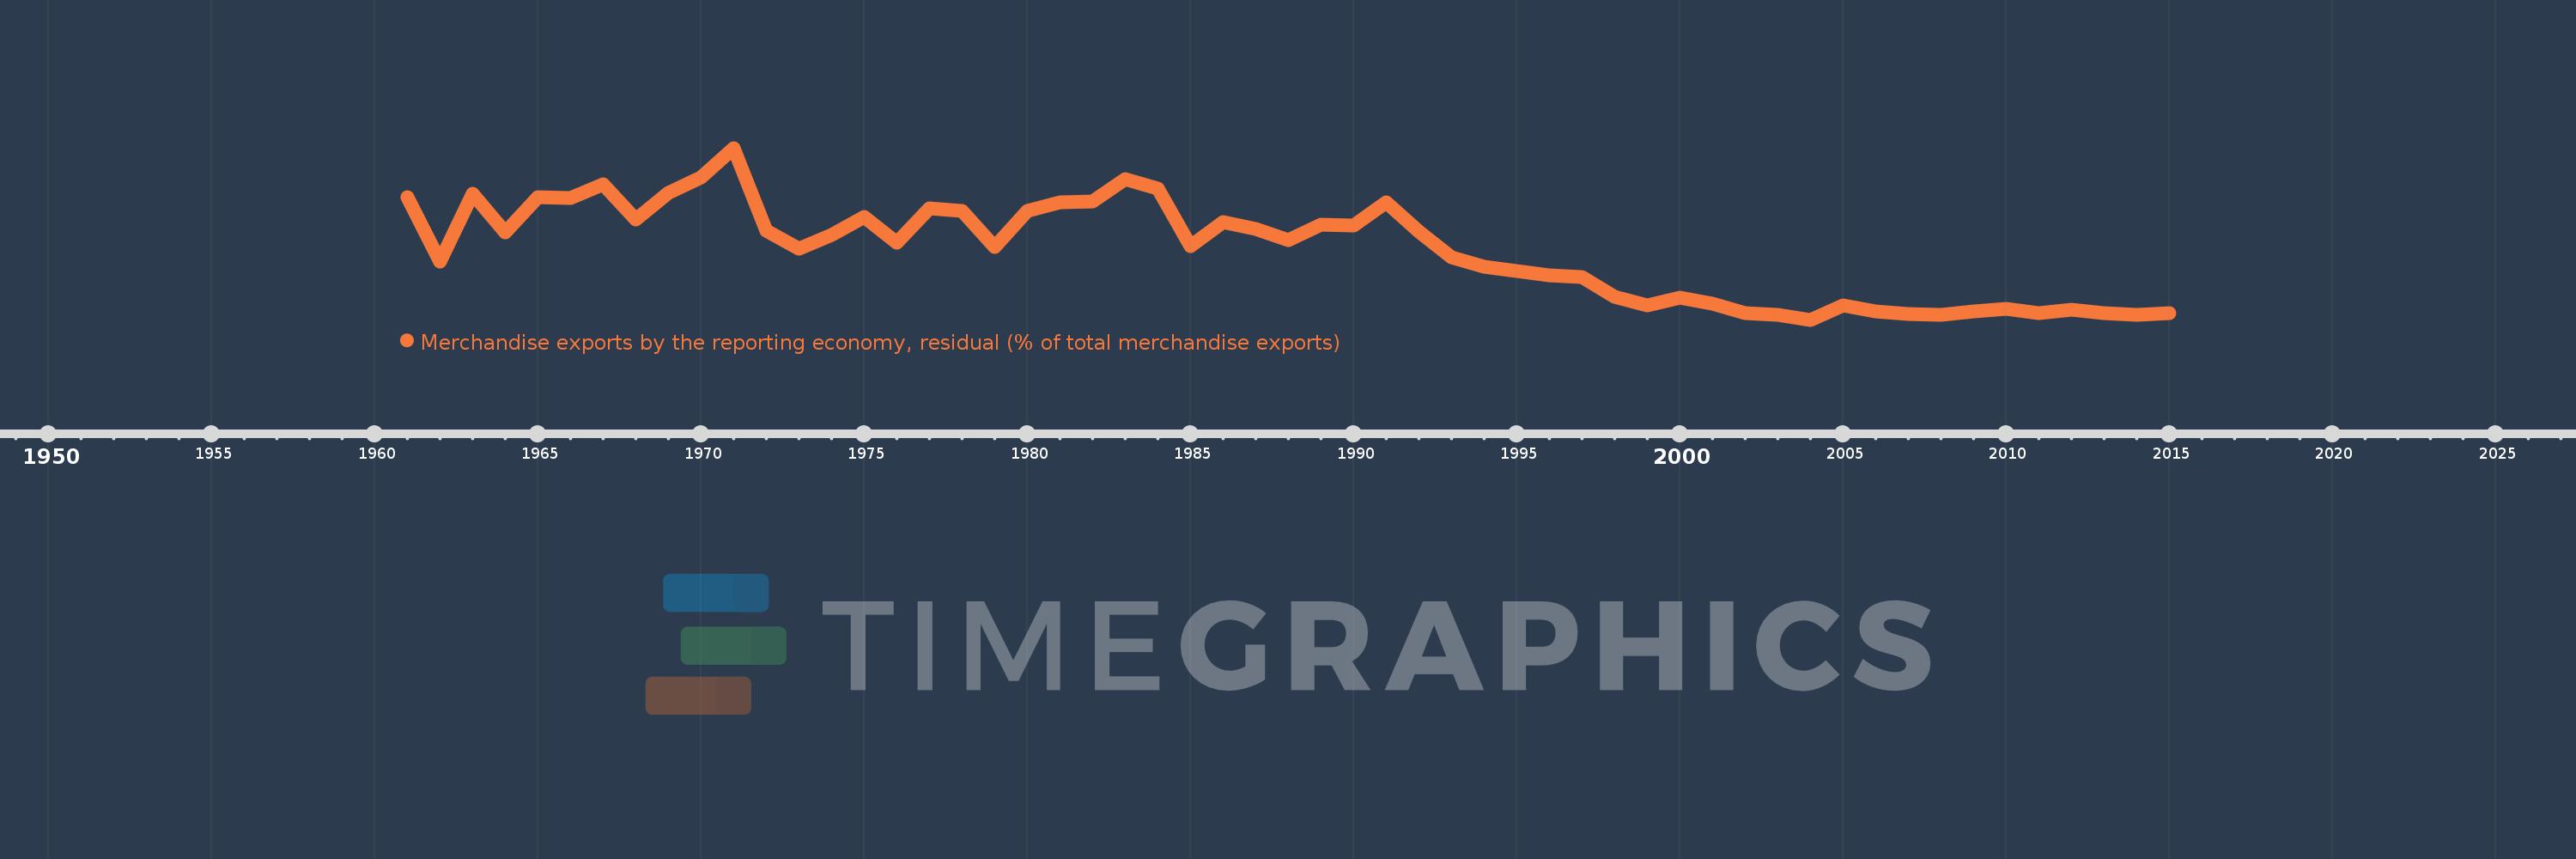
Merchandise exports by the reporting economy, residual (% of total merchandise exports)
2015,2014,2013,2012,2011,2010,2009,2008,2007,2006,2005,2004,2003,2002,2001,2000,1999,1998,1997,1996,1995,1994,1993,1992,1991,1990,1989,1988,1987,1986,1985,1984,1983,1982,1981,1980,1979,1978,1977,1976,1975,1974,1973,1972,1971,1970,1969,1968,1967,1966,1965,1964,1963,1962,1961
Queste statistiche in altri paesi:
AfghanistanAlbaniaAlgeriaAmerican SamoaAngolaAntigua and BarbudaArab WorldArgentinaArmeniaArubaAustraliaAustriaAzerbaijanBahamas, TheBahrainBangladeshBarbadosBelarusBelgiumBelizeBeninBermudaBoliviaBosnia and HerzegovinaBrazilBrunei DarussalamBulgariaBurkina FasoBurundiCabo VerdeCambodiaCameroonCanadaCaribbean small statesCentral African RepublicCentral Europe and the BalticsChadChileChinaColombiaComorosCongo, Dem. Rep.Congo, Rep.Costa RicaCote d'IvoireCroatiaCubaCyprusCzech RepublicDenmarkDjiboutiDominicaDominican RepublicEarly-demographic dividendEast Asia & PacificEast Asia & Pacific (excluding high income)East Asia & Pacific (IDA & IBRD countries)EcuadorEgypt, Arab Rep.El SalvadorEquatorial GuineaEstoniaEthiopiaEuro areaEurope & Central AsiaEurope & Central Asia (excluding high income)Europe & Central Asia (IDA & IBRD countries)European UnionFaroe IslandsFijiFinlandFragile and conflict affected situationsFranceFrench PolynesiaGabonGambia, TheGeorgiaGermanyGhanaGibraltarGreeceGreenlandGrenadaGuamGuatemalaGuineaGuinea-BissauGuyanaHaitiHeavily indebted poor countries (HIPC)High incomeHondurasHong Kong SAR, ChinaHungaryIBRD onlyIcelandIDA & IBRD totalIDA blendIDA onlyIDA totalIndiaIndonesiaIran, Islamic Rep.IraqIrelandIsraelItalyJamaicaJapanJordanKazakhstanKenyaKiribatiKorea, Dem. People’s Rep.Korea, Rep.KosovoKuwaitKyrgyz RepublicLao PDRLate-demographic dividendLatin America & Caribbean Latin America & Caribbean (excluding high income)Latin America & the Caribbean (IDA & IBRD countries)LatviaLeast developed countries: UN classificationLebanonLiberiaLibyaLithuaniaLow & middle incomeLow incomeLower middle incomeLuxembourgMacao SAR, ChinaMacedonia, FYRMadagascarMalawiMalaysiaMaldivesMaliMaltaMauritaniaMauritiusMexicoMiddle East & North AfricaMiddle East & North Africa (excluding high income)Middle East & North Africa (IDA & IBRD countries)Middle incomeMoldovaMongoliaMontenegroMoroccoMozambiqueMyanmarNauruNepalNetherlandsNew CaledoniaNew ZealandNicaraguaNigerNigeriaNorth AmericaNorwayOECD membersOmanOther small statesPacific island small statesPakistanPanamaPapua New GuineaParaguayPeruPhilippinesPolandPortugalPost-demographic dividendPre-demographic dividendQatarRomaniaRussian FederationRwandaSamoaSao Tome and PrincipeSaudi ArabiaSenegalSerbiaSeychellesSierra LeoneSingaporeSlovak RepublicSloveniaSmall statesSolomon IslandsSomaliaSouth AfricaSouth AsiaSouth Asia (IDA & IBRD)SpainSri LankaSt. Kitts and NevisSt. LuciaSt. Vincent and the GrenadinesSub-Saharan Africa Sub-Saharan Africa (excluding high income)Sub-Saharan Africa (IDA & IBRD countries)SudanSurinameSwedenSwitzerlandSyrian Arab RepublicTajikistanTanzaniaThailandTogoTongaTrinidad and TobagoTunisiaTurkeyTurkmenistanTuvaluUgandaUkraineUnited Arab EmiratesUnited KingdomUnited StatesUpper middle incomeUruguayUzbekistanVanuatuVenezuela, RBVietnamWorldYemen, Rep.ZambiaZimbabwe Linea del tempo:
Questa scala temporale mostra un grafico dal 1961 anno al 2015 anno. New Zealand. I dati fino ad 1960 anno non disponibili. Il numero di osservazioni attuali secondo i date: 55.
La fonte (nome):
Indicatori dello sviluppo mondiale
La fonte (organizzazione):
World Bank staff estimates based data from International Monetary Fund's Direction of Trade database.
Categorie:
Private Sector, Trade
sono stati aggiornati
23 apr 2017 anni
Indicatori delle variazioni dei valori per anni
Minima:
1.545
1 gen 2004 anni
Massimo:
12.397
1 gen 1971 anni
Alla data di osservazione
Valore
Variazione assoluta
La variazione rispetto al valore precedente
1 gen 1961 anni
9.303
+9.303
0.0%
1 gen 1962 anni
5.205
-4.098
-44.05%
1 gen 1963 anni
9.505
+4.3
82.6%
1 gen 1964 anni
7.073
-2.432
-25.58%
1 gen 1965 anni
9.284
+2.211
31.26%
1 gen 1966 anni
9.252
-0.033
-0.35%
1 gen 1967 anni
10.088
+0.837
9.04%
1 gen 1968 anni
7.879
-2.209
-21.9%
1 gen 1969 anni
9.536
+1.657
21.02%
1 gen 1970 anni
10.557
+1.021
10.71%
1 gen 1971 anni
12.397
+1.84
17.43%
1 gen 1972 anni
7.175
-5.222
-42.12%
1 gen 1973 anni
6.026
-1.149
-16.02%
1 gen 1974 anni
6.888
+0.862
14.3%
1 gen 1975 anni
8.034
+1.147
16.65%
1 gen 1976 anni
6.396
-1.638
-20.38%
1 gen 1977 anni
8.563
+2.166
33.87%
1 gen 1978 anni
8.437
-0.126
-1.47%
1 gen 1979 anni
6.119
-2.318
-27.48%
1 gen 1980 anni
8.422
+2.303
37.63%
1 gen 1981 anni
8.962
+0.541
6.42%
1 gen 1982 anni
9.021
+0.059
0.66%
1 gen 1983 anni
10.402
+1.381
15.31%
1 gen 1984 anni
9.837
-0.565
-5.43%
1 gen 1985 anni
6.213
-3.625
-36.85%
1 gen 1986 anni
7.714
+1.501
24.17%
1 gen 1987 anni
7.256
-0.458
-5.93%
1 gen 1988 anni
6.582
-0.674
-9.29%
1 gen 1989 anni
7.576
+0.994
15.1%
1 gen 1990 anni
7.513
-0.063
-0.83%
1 gen 1991 anni
8.97
+1.457
19.4%
1 gen 1992 anni
7.14
-1.83
-20.4%
1 gen 1993 anni
5.509
-1.631
-22.84%
1 gen 1994 anni
4.872
-0.638
-11.57%
1 gen 1995 anni
4.605
-0.267
-5.49%
1 gen 1996 anni
4.368
-0.236
-5.13%
1 gen 1997 anni
4.248
-0.12
-2.75%
1 gen 1998 anni
3.001
-1.247
-29.35%
1 gen 1999 anni
2.447
-0.554
-18.47%
1 gen 2000 anni
2.953
+0.506
20.68%
1 gen 2001 anni
2.544
-0.409
-13.84%
1 gen 2002 anni
1.938
-0.606
-23.82%
1 gen 2003 anni
1.835
-0.103
-5.31%
1 gen 2004 anni
1.545
-0.291
-15.83%
1 gen 2005 anni
2.427
+0.883
57.15%
1 gen 2006 anni
2.077
-0.351
-14.45%
1 gen 2007 anni
1.934
-0.143
-6.87%
1 gen 2008 anni
1.866
-0.068
-3.51%
1 gen 2009 anni
2.098
+0.232
12.41%
1 gen 2010 anni
2.212
+0.115
5.46%
1 gen 2011 anni
1.937
-0.276
-12.46%
1 gen 2012 anni
2.163
+0.226
11.69%
1 gen 2013 anni
1.956
-0.207
-9.57%
1 gen 2014 anni
1.829
-0.127
-6.49%
1 gen 2015 anni
1.967
+0.138
7.54%
Classificazione dei paesi secondo i statistiche attuali per anni


Commenti: