29
/it/
it
AIzaSyAYiBZKx7MnpbEhh9jyipgxe19OcubqV5w
April 1, 2024
42414
Latin America & Caribbean (excluding high income)
LAC
false
2
1
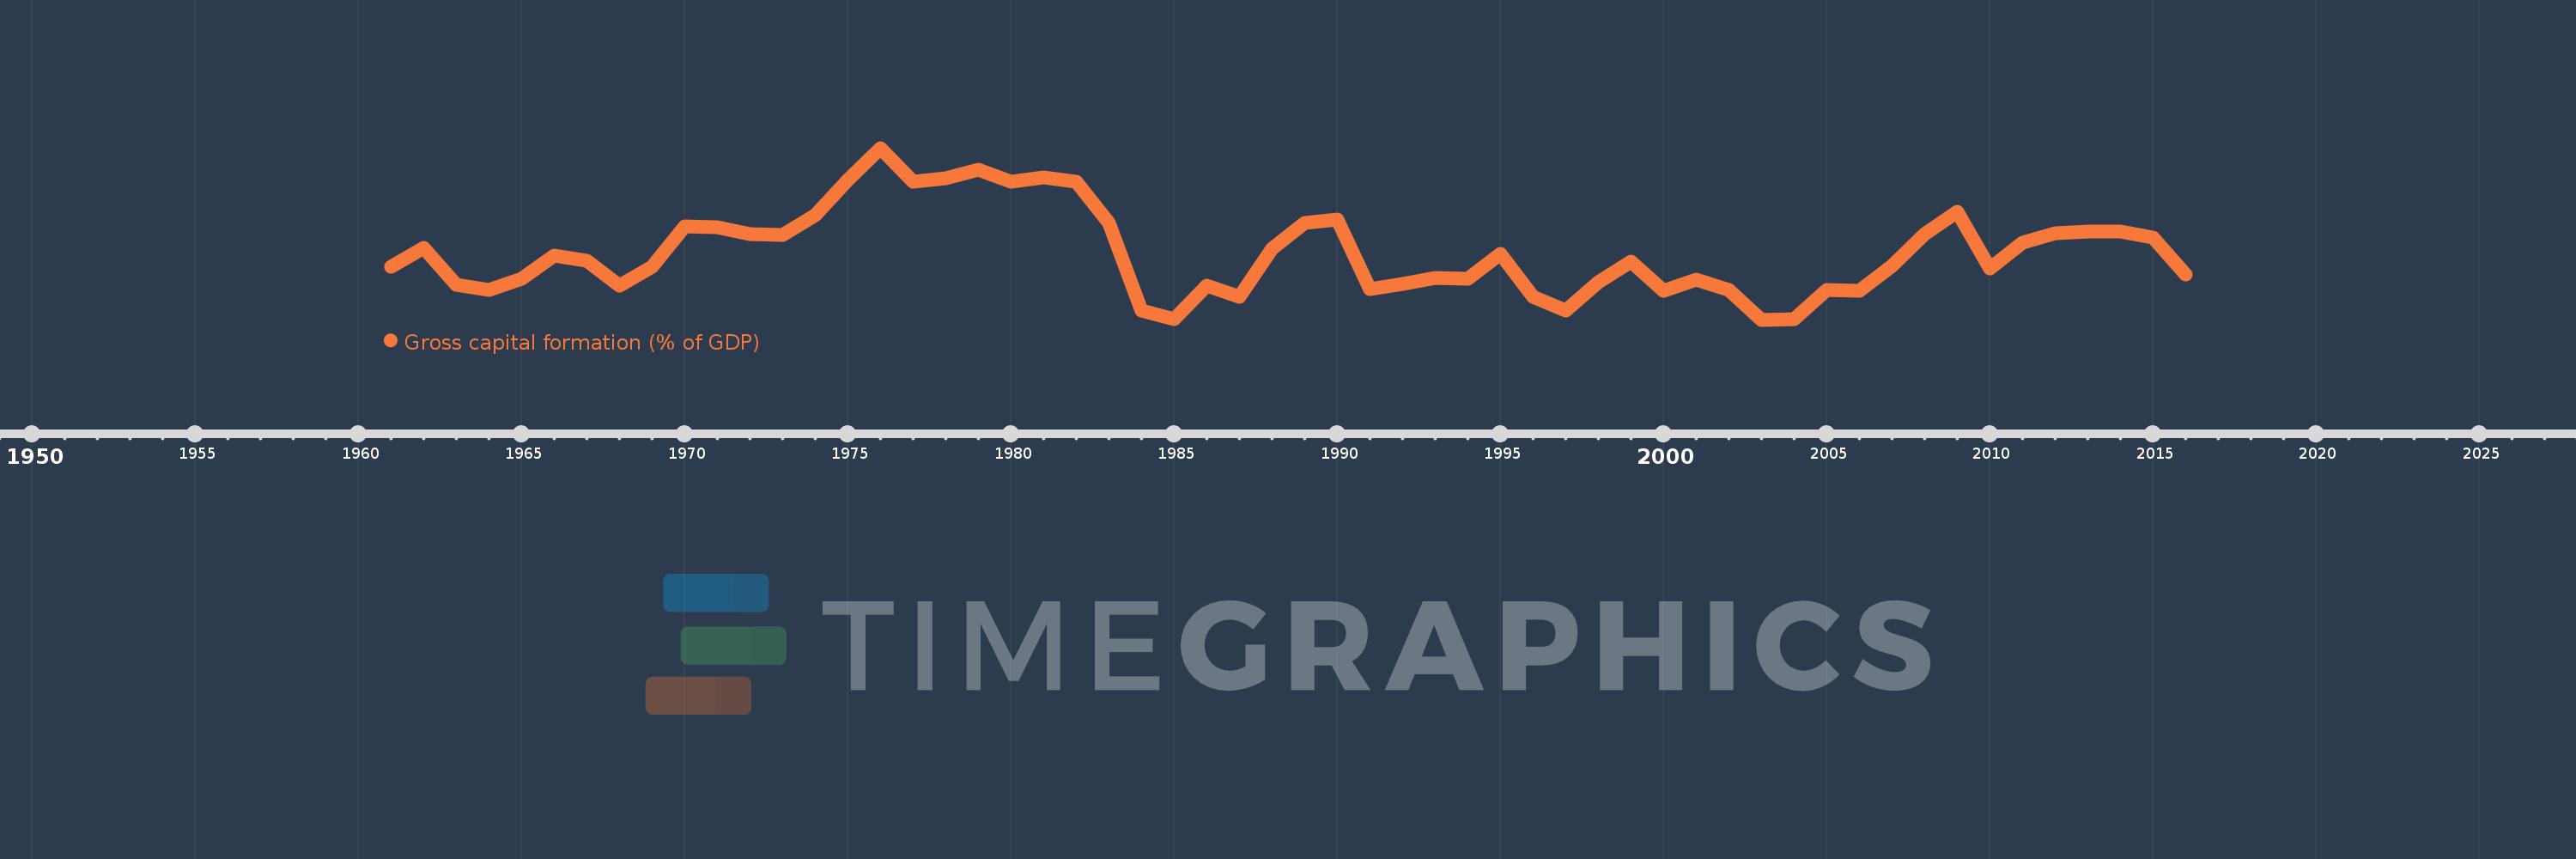
Gross capital formation (% of GDP)
2016,2015,2014,2013,2012,2011,2010,2009,2008,2007,2006,2005,2004,2003,2002,2001,2000,1999,1998,1997,1996,1995,1994,1993,1992,1991,1990,1989,1988,1987,1986,1985,1984,1983,1982,1981,1980,1979,1978,1977,1976,1975,1974,1973,1972,1971,1970,1969,1968,1967,1966,1965,1964,1963,1962,1961
Queste statistiche in altri paesi:
AfghanistanAlbaniaAlgeriaAngolaAntigua and BarbudaArab WorldArgentinaArmeniaArubaAustraliaAustriaAzerbaijanBahamas, TheBahrainBangladeshBarbadosBelarusBelgiumBelizeBeninBermudaBhutanBoliviaBosnia and HerzegovinaBotswanaBrazilBrunei DarussalamBulgariaBurkina FasoBurundiCabo VerdeCambodiaCameroonCanadaCaribbean small statesCentral African RepublicCentral Europe and the BalticsChadChileChinaColombiaComorosCongo, Dem. Rep.Congo, Rep.Costa RicaCote d'IvoireCroatiaCubaCyprusCzech RepublicDenmarkDjiboutiDominicaDominican RepublicEarly-demographic dividendEast Asia & PacificEast Asia & Pacific (excluding high income)East Asia & Pacific (IDA & IBRD countries)EcuadorEgypt, Arab Rep.El SalvadorEquatorial GuineaEritreaEstoniaEthiopiaEuro areaEurope & Central AsiaEurope & Central Asia (excluding high income)Europe & Central Asia (IDA & IBRD countries)European UnionFaroe IslandsFijiFinlandFragile and conflict affected situationsFranceGabonGambia, TheGeorgiaGermanyGhanaGreeceGrenadaGuatemalaGuineaGuinea-BissauGuyanaHaitiHeavily indebted poor countries (HIPC)High incomeHondurasHong Kong SAR, ChinaHungaryIBRD onlyIcelandIDA & IBRD totalIDA blendIDA onlyIDA totalIndiaIndonesiaIran, Islamic Rep.IraqIrelandIsraelItalyJamaicaJapanJordanKazakhstanKenyaKiribatiKorea, Rep.KosovoKuwaitKyrgyz RepublicLao PDRLate-demographic dividendLatin America & Caribbean Latin America & Caribbean (excluding high income)Latin America & the Caribbean (IDA & IBRD countries)LatviaLeast developed countries: UN classificationLebanonLesothoLiberiaLibyaLithuaniaLow & middle incomeLow incomeLower middle incomeLuxembourgMacao SAR, ChinaMacedonia, FYRMadagascarMalawiMalaysiaMaldivesMaliMaltaMauritaniaMauritiusMexicoMicronesia, Fed. Sts.Middle East & North AfricaMiddle East & North Africa (excluding high income)Middle East & North Africa (IDA & IBRD countries)Middle incomeMoldovaMongoliaMontenegroMoroccoMozambiqueNamibiaNepalNetherlandsNew CaledoniaNew ZealandNicaraguaNigerNigeriaNorth AmericaNorwayOECD membersOmanOther small statesPacific island small statesPakistanPanamaPapua New GuineaParaguayPeruPhilippinesPolandPortugalPost-demographic dividendPre-demographic dividendPuerto RicoQatarRomaniaRussian FederationRwandaSaudi ArabiaSenegalSerbiaSeychellesSierra LeoneSingaporeSlovak RepublicSloveniaSmall statesSolomon IslandsSomaliaSouth AfricaSouth AsiaSouth Asia (IDA & IBRD)South SudanSpainSri LankaSt. Kitts and NevisSt. LuciaSt. Vincent and the GrenadinesSub-Saharan Africa Sub-Saharan Africa (excluding high income)Sub-Saharan Africa (IDA & IBRD countries)SudanSurinameSwazilandSwedenSwitzerlandSyrian Arab RepublicTajikistanTanzaniaThailandTimor-LesteTogoTongaTrinidad and TobagoTunisiaTurkeyTurkmenistanUgandaUkraineUnited Arab EmiratesUnited KingdomUnited StatesUpper middle incomeUruguayUzbekistanVanuatuVenezuela, RBVietnamWest Bank and GazaWorldYemen, Rep.ZambiaZimbabwe Linea del tempo:
Questa scala temporale mostra un grafico dal 1961 anno al 2016 anno. Latin America & Caribbean (excluding high income). I dati fino ad 1960 anno non disponibili. Il numero di osservazioni attuali secondo i date: 56.
La fonte (nome):
Indicatori dello sviluppo mondiale
La fonte (organizzazione):
World Bank national accounts data, and OECD National Accounts data files.
Categorie:
Economy & Growth
sono stati aggiornati
23 apr 2017 anni
Indicatori delle variazioni dei valori per anni
Minima:
17.931
1 gen 2003 anni
Massimo:
26.013
1 gen 1976 anni
Alla data di osservazione
Valore
Variazione assoluta
La variazione rispetto al valore precedente
1 gen 1961 anni
20.419
+20.419
0.0%
1 gen 1962 anni
21.311
+0.892
4.37%
1 gen 1963 anni
19.582
-1.729
-8.11%
1 gen 1964 anni
19.351
-0.231
-1.18%
1 gen 1965 anni
19.867
+0.516
2.67%
1 gen 1966 anni
20.942
+1.075
5.41%
1 gen 1967 anni
20.707
-0.235
-1.12%
1 gen 1968 anni
19.523
-1.184
-5.72%
1 gen 1969 anni
20.442
+0.919
4.71%
1 gen 1970 anni
22.325
+1.883
9.21%
1 gen 1971 anni
22.289
-0.036
-0.16%
1 gen 1972 anni
21.98
-0.309
-1.39%
1 gen 1973 anni
21.905
-0.075
-0.34%
1 gen 1974 anni
22.867
+0.962
4.39%
1 gen 1975 anni
24.5
+1.633
7.14%
1 gen 1976 anni
26.013
+1.512
6.17%
1 gen 1977 anni
24.425
-1.588
-6.1%
1 gen 1978 anni
24.598
+0.173
0.71%
1 gen 1979 anni
25.0
+0.402
1.63%
1 gen 1980 anni
24.415
-0.585
-2.34%
1 gen 1981 anni
24.636
+0.221
0.9%
1 gen 1982 anni
24.433
-0.203
-0.82%
1 gen 1983 anni
22.48
-1.953
-7.99%
1 gen 1984 anni
18.364
-4.116
-18.31%
1 gen 1985 anni
17.952
-0.412
-2.24%
1 gen 1986 anni
19.525
+1.573
8.76%
1 gen 1987 anni
18.993
-0.532
-2.73%
1 gen 1988 anni
21.256
+2.263
11.92%
1 gen 1989 anni
22.472
+1.216
5.72%
1 gen 1990 anni
22.667
+0.195
0.87%
1 gen 1991 anni
19.359
-3.308
-14.59%
1 gen 1992 anni
19.636
+0.277
1.43%
1 gen 1993 anni
19.919
+0.283
1.44%
1 gen 1994 anni
19.874
-0.045
-0.23%
1 gen 1995 anni
21.034
+1.16
5.84%
1 gen 1996 anni
18.99
-2.044
-9.72%
1 gen 1997 anni
18.359
-0.632
-3.33%
1 gen 1998 anni
19.687
+1.328
7.24%
1 gen 1999 anni
20.659
+0.972
4.94%
1 gen 2000 anni
19.299
-1.36
-6.58%
1 gen 2001 anni
19.803
+0.504
2.61%
1 gen 2002 anni
19.352
-0.45
-2.27%
1 gen 2003 anni
17.931
-1.421
-7.34%
1 gen 2004 anni
17.944
+0.013
0.07%
1 gen 2005 anni
19.345
+1.4
7.8%
1 gen 2006 anni
19.3
-0.045
-0.23%
1 gen 2007 anni
20.452
+1.152
5.97%
1 gen 2008 anni
21.966
+1.514
7.4%
1 gen 2009 anni
22.999
+1.033
4.7%
1 gen 2010 anni
20.341
-2.658
-11.56%
1 gen 2011 anni
21.562
+1.221
6.0%
1 gen 2012 anni
21.988
+0.426
1.98%
1 gen 2013 anni
22.086
+0.099
0.45%
1 gen 2014 anni
22.07
-0.017
-0.07%
1 gen 2015 anni
21.806
-0.263
-1.19%
1 gen 2016 anni
20.049
-1.757
-8.06%
Classificazione dei paesi secondo i statistiche attuali per anni


Commenti: