29
/it/
it
AIzaSyAYiBZKx7MnpbEhh9jyipgxe19OcubqV5w
April 1, 2024
102473
Central African Republic
CAF
true
2
1
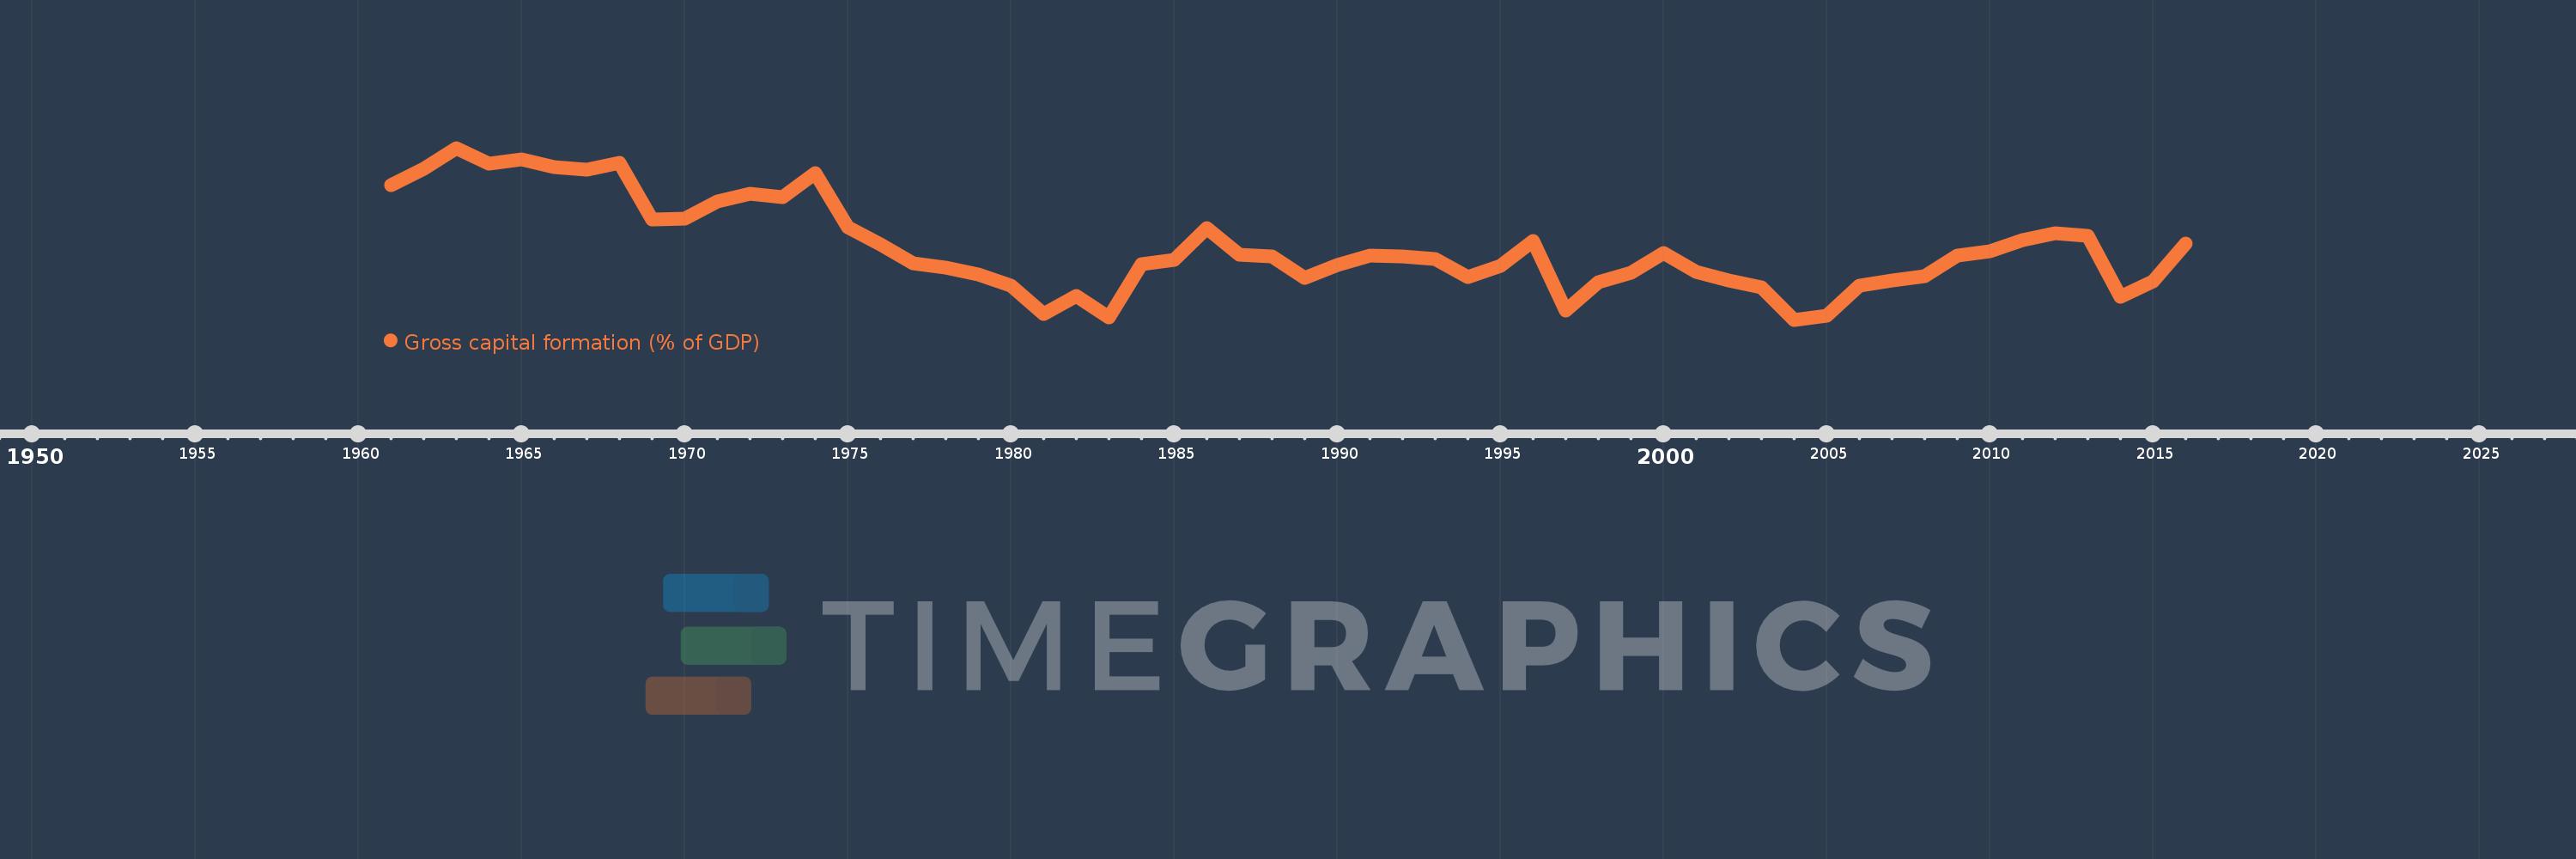
Gross capital formation (% of GDP)
2016,2015,2014,2013,2012,2011,2010,2009,2008,2007,2006,2005,2004,2003,2002,2001,2000,1999,1998,1997,1996,1995,1994,1993,1992,1991,1990,1989,1988,1987,1986,1985,1984,1983,1982,1981,1980,1979,1978,1977,1976,1975,1974,1973,1972,1971,1970,1969,1968,1967,1966,1965,1964,1963,1962,1961
Queste statistiche in altri paesi:
AfghanistanAlbaniaAlgeriaAngolaAntigua and BarbudaArab WorldArgentinaArmeniaArubaAustraliaAustriaAzerbaijanBahamas, TheBahrainBangladeshBarbadosBelarusBelgiumBelizeBeninBermudaBhutanBoliviaBosnia and HerzegovinaBotswanaBrazilBrunei DarussalamBulgariaBurkina FasoBurundiCabo VerdeCambodiaCameroonCanadaCaribbean small statesCentral African RepublicCentral Europe and the BalticsChadChileChinaColombiaComorosCongo, Dem. Rep.Congo, Rep.Costa RicaCote d'IvoireCroatiaCubaCyprusCzech RepublicDenmarkDjiboutiDominicaDominican RepublicEarly-demographic dividendEast Asia & PacificEast Asia & Pacific (excluding high income)East Asia & Pacific (IDA & IBRD countries)EcuadorEgypt, Arab Rep.El SalvadorEquatorial GuineaEritreaEstoniaEthiopiaEuro areaEurope & Central AsiaEurope & Central Asia (excluding high income)Europe & Central Asia (IDA & IBRD countries)European UnionFaroe IslandsFijiFinlandFragile and conflict affected situationsFranceGabonGambia, TheGeorgiaGermanyGhanaGreeceGrenadaGuatemalaGuineaGuinea-BissauGuyanaHaitiHeavily indebted poor countries (HIPC)High incomeHondurasHong Kong SAR, ChinaHungaryIBRD onlyIcelandIDA & IBRD totalIDA blendIDA onlyIDA totalIndiaIndonesiaIran, Islamic Rep.IraqIrelandIsraelItalyJamaicaJapanJordanKazakhstanKenyaKiribatiKorea, Rep.KosovoKuwaitKyrgyz RepublicLao PDRLate-demographic dividendLatin America & Caribbean Latin America & Caribbean (excluding high income)Latin America & the Caribbean (IDA & IBRD countries)LatviaLeast developed countries: UN classificationLebanonLesothoLiberiaLibyaLithuaniaLow & middle incomeLow incomeLower middle incomeLuxembourgMacao SAR, ChinaMacedonia, FYRMadagascarMalawiMalaysiaMaldivesMaliMaltaMauritaniaMauritiusMexicoMicronesia, Fed. Sts.Middle East & North AfricaMiddle East & North Africa (excluding high income)Middle East & North Africa (IDA & IBRD countries)Middle incomeMoldovaMongoliaMontenegroMoroccoMozambiqueNamibiaNepalNetherlandsNew CaledoniaNew ZealandNicaraguaNigerNigeriaNorth AmericaNorwayOECD membersOmanOther small statesPacific island small statesPakistanPanamaPapua New GuineaParaguayPeruPhilippinesPolandPortugalPost-demographic dividendPre-demographic dividendPuerto RicoQatarRomaniaRussian FederationRwandaSaudi ArabiaSenegalSerbiaSeychellesSierra LeoneSingaporeSlovak RepublicSloveniaSmall statesSolomon IslandsSomaliaSouth AfricaSouth AsiaSouth Asia (IDA & IBRD)South SudanSpainSri LankaSt. Kitts and NevisSt. LuciaSt. Vincent and the GrenadinesSub-Saharan Africa Sub-Saharan Africa (excluding high income)Sub-Saharan Africa (IDA & IBRD countries)SudanSurinameSwazilandSwedenSwitzerlandSyrian Arab RepublicTajikistanTanzaniaThailandTimor-LesteTogoTongaTrinidad and TobagoTunisiaTurkeyTurkmenistanUgandaUkraineUnited Arab EmiratesUnited KingdomUnited StatesUpper middle incomeUruguayUzbekistanVanuatuVenezuela, RBVietnamWest Bank and GazaWorldYemen, Rep.ZambiaZimbabwe Linea del tempo:
Questa scala temporale mostra un grafico dal 1961 anno al 2016 anno. Central African Republic. I dati fino ad 1960 anno non disponibili. Il numero di osservazioni attuali secondo i date: 56.
La fonte (nome):
Indicatori dello sviluppo mondiale
La fonte (organizzazione):
World Bank national accounts data, and OECD National Accounts data files.
Categorie:
Economy & Growth
sono stati aggiornati
23 apr 2017 anni
Indicatori delle variazioni dei valori per anni
Minima:
6.405
1 gen 2004 anni
Massimo:
23.279
1 gen 1963 anni
Alla data di osservazione
Valore
Variazione assoluta
La variazione rispetto al valore precedente
1 gen 1961 anni
19.636
+19.636
0.0%
1 gen 1962 anni
21.192
+1.556
7.92%
1 gen 1963 anni
23.279
+2.087
9.85%
1 gen 1964 anni
21.767
-1.512
-6.5%
1 gen 1965 anni
22.126
+0.36
1.65%
1 gen 1966 anni
21.409
-0.717
-3.24%
1 gen 1967 anni
21.134
-0.275
-1.29%
1 gen 1968 anni
21.836
+0.702
3.32%
1 gen 1969 anni
16.219
-5.617
-25.72%
1 gen 1970 anni
16.366
+0.147
0.9%
1 gen 1971 anni
17.984
+1.618
9.89%
1 gen 1972 anni
18.749
+0.765
4.25%
1 gen 1973 anni
18.434
-0.315
-1.68%
1 gen 1974 anni
20.846
+2.412
13.09%
1 gen 1975 anni
15.502
-5.344
-25.64%
1 gen 1976 anni
13.801
-1.701
-10.97%
1 gen 1977 anni
11.966
-1.835
-13.3%
1 gen 1978 anni
11.554
-0.412
-3.45%
1 gen 1979 anni
10.887
-0.667
-5.77%
1 gen 1980 anni
9.794
-1.093
-10.04%
1 gen 1981 anni
7.007
-2.787
-28.46%
1 gen 1982 anni
8.739
+1.732
24.72%
1 gen 1983 anni
6.669
-2.07
-23.69%
1 gen 1984 anni
11.833
+5.163
77.42%
1 gen 1985 anni
12.307
+0.474
4.01%
1 gen 1986 anni
15.384
+3.077
25.0%
1 gen 1987 anni
12.779
-2.605
-16.93%
1 gen 1988 anni
12.631
-0.148
-1.16%
1 gen 1989 anni
10.509
-2.122
-16.8%
1 gen 1990 anni
11.756
+1.246
11.86%
1 gen 1991 anni
12.708
+0.952
8.1%
1 gen 1992 anni
12.648
-0.06
-0.47%
1 gen 1993 anni
12.403
-0.246
-1.94%
1 gen 1994 anni
10.578
-1.824
-14.71%
1 gen 1995 anni
11.706
+1.128
10.66%
1 gen 1996 anni
14.119
+2.413
20.61%
1 gen 1997 anni
7.275
-6.844
-48.47%
1 gen 1998 anni
10.08
+2.805
38.56%
1 gen 1999 anni
11.013
+0.933
9.25%
1 gen 2000 anni
12.962
+1.949
17.7%
1 gen 2001 anni
11.072
-1.89
-14.58%
1 gen 2002 anni
10.241
-0.831
-7.51%
1 gen 2003 anni
9.625
-0.616
-6.01%
1 gen 2004 anni
6.405
-3.22
-33.46%
1 gen 2005 anni
6.812
+0.407
6.36%
1 gen 2006 anni
9.77
+2.958
43.42%
1 gen 2007 anni
10.234
+0.464
4.75%
1 gen 2008 anni
10.684
+0.45
4.39%
1 gen 2009 anni
12.728
+2.045
19.14%
1 gen 2010 anni
13.165
+0.437
3.43%
1 gen 2011 anni
14.266
+1.1
8.36%
1 gen 2012 anni
14.861
+0.595
4.17%
1 gen 2013 anni
14.662
-0.199
-1.34%
1 gen 2014 anni
8.691
-5.971
-40.72%
1 gen 2015 anni
10.2
+1.508
17.35%
1 gen 2016 anni
13.923
+3.723
36.5%
Classificazione dei paesi secondo i statistiche attuali per anni


Commenti: