29
/it/
it
AIzaSyAYiBZKx7MnpbEhh9jyipgxe19OcubqV5w
April 1, 2024
264644
Togo
TGO
true
2
1
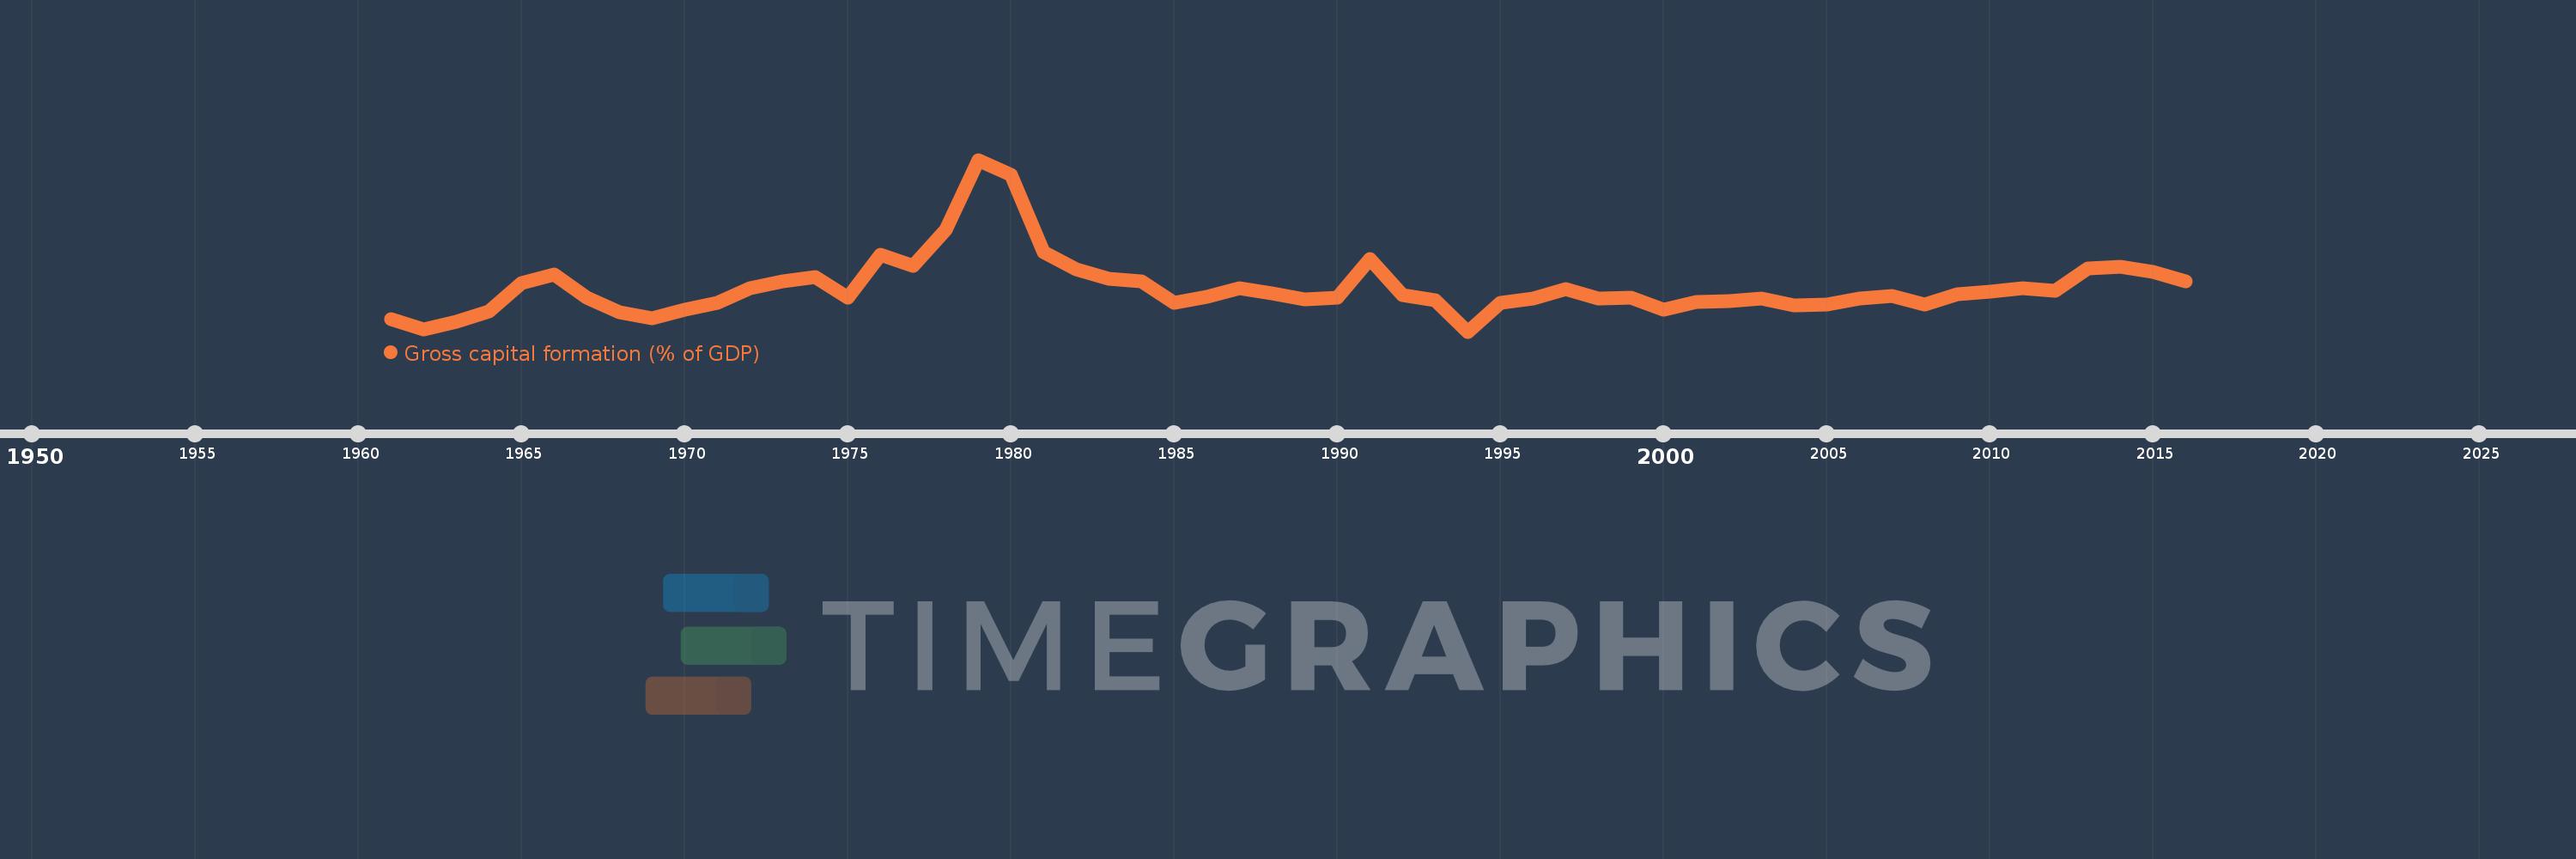
Gross capital formation (% of GDP)
2016,2015,2014,2013,2012,2011,2010,2009,2008,2007,2006,2005,2004,2003,2002,2001,2000,1999,1998,1997,1996,1995,1994,1993,1992,1991,1990,1989,1988,1987,1986,1985,1984,1983,1982,1981,1980,1979,1978,1977,1976,1975,1974,1973,1972,1971,1970,1969,1968,1967,1966,1965,1964,1963,1962,1961
Queste statistiche in altri paesi:
AfghanistanAlbaniaAlgeriaAngolaAntigua and BarbudaArab WorldArgentinaArmeniaArubaAustraliaAustriaAzerbaijanBahamas, TheBahrainBangladeshBarbadosBelarusBelgiumBelizeBeninBermudaBhutanBoliviaBosnia and HerzegovinaBotswanaBrazilBrunei DarussalamBulgariaBurkina FasoBurundiCabo VerdeCambodiaCameroonCanadaCaribbean small statesCentral African RepublicCentral Europe and the BalticsChadChileChinaColombiaComorosCongo, Dem. Rep.Congo, Rep.Costa RicaCote d'IvoireCroatiaCubaCyprusCzech RepublicDenmarkDjiboutiDominicaDominican RepublicEarly-demographic dividendEast Asia & PacificEast Asia & Pacific (excluding high income)East Asia & Pacific (IDA & IBRD countries)EcuadorEgypt, Arab Rep.El SalvadorEquatorial GuineaEritreaEstoniaEthiopiaEuro areaEurope & Central AsiaEurope & Central Asia (excluding high income)Europe & Central Asia (IDA & IBRD countries)European UnionFaroe IslandsFijiFinlandFragile and conflict affected situationsFranceGabonGambia, TheGeorgiaGermanyGhanaGreeceGrenadaGuatemalaGuineaGuinea-BissauGuyanaHaitiHeavily indebted poor countries (HIPC)High incomeHondurasHong Kong SAR, ChinaHungaryIBRD onlyIcelandIDA & IBRD totalIDA blendIDA onlyIDA totalIndiaIndonesiaIran, Islamic Rep.IraqIrelandIsraelItalyJamaicaJapanJordanKazakhstanKenyaKiribatiKorea, Rep.KosovoKuwaitKyrgyz RepublicLao PDRLate-demographic dividendLatin America & Caribbean Latin America & Caribbean (excluding high income)Latin America & the Caribbean (IDA & IBRD countries)LatviaLeast developed countries: UN classificationLebanonLesothoLiberiaLibyaLithuaniaLow & middle incomeLow incomeLower middle incomeLuxembourgMacao SAR, ChinaMacedonia, FYRMadagascarMalawiMalaysiaMaldivesMaliMaltaMauritaniaMauritiusMexicoMicronesia, Fed. Sts.Middle East & North AfricaMiddle East & North Africa (excluding high income)Middle East & North Africa (IDA & IBRD countries)Middle incomeMoldovaMongoliaMontenegroMoroccoMozambiqueNamibiaNepalNetherlandsNew CaledoniaNew ZealandNicaraguaNigerNigeriaNorth AmericaNorwayOECD membersOmanOther small statesPacific island small statesPakistanPanamaPapua New GuineaParaguayPeruPhilippinesPolandPortugalPost-demographic dividendPre-demographic dividendPuerto RicoQatarRomaniaRussian FederationRwandaSaudi ArabiaSenegalSerbiaSeychellesSierra LeoneSingaporeSlovak RepublicSloveniaSmall statesSolomon IslandsSomaliaSouth AfricaSouth AsiaSouth Asia (IDA & IBRD)South SudanSpainSri LankaSt. Kitts and NevisSt. LuciaSt. Vincent and the GrenadinesSub-Saharan Africa Sub-Saharan Africa (excluding high income)Sub-Saharan Africa (IDA & IBRD countries)SudanSurinameSwazilandSwedenSwitzerlandSyrian Arab RepublicTajikistanTanzaniaThailandTimor-LesteTogoTongaTrinidad and TobagoTunisiaTurkeyTurkmenistanUgandaUkraineUnited Arab EmiratesUnited KingdomUnited StatesUpper middle incomeUruguayUzbekistanVanuatuVenezuela, RBVietnamWest Bank and GazaWorldYemen, Rep.ZambiaZimbabwe Linea del tempo:
Questa scala temporale mostra un grafico dal 1961 anno al 2016 anno. Togo. I dati fino ad 1960 anno non disponibili. Il numero di osservazioni attuali secondo i date: 56.
La fonte (nome):
Indicatori dello sviluppo mondiale
La fonte (organizzazione):
World Bank national accounts data, and OECD National Accounts data files.
Categorie:
Economy & Growth
sono stati aggiornati
23 apr 2017 anni
Indicatori delle variazioni dei valori per anni
Minima:
7.478
1 gen 1994 anni
Massimo:
52.688
1 gen 1979 anni
Alla data di osservazione
Valore
Variazione assoluta
La variazione rispetto al valore precedente
1 gen 1961 anni
10.774
+10.774
0.0%
1 gen 1962 anni
8.065
-2.71
-25.15%
1 gen 1963 anni
10.185
+2.121
26.3%
1 gen 1964 anni
12.821
+2.635
25.87%
1 gen 1965 anni
20.147
+7.327
57.15%
1 gen 1966 anni
22.44
+2.293
11.38%
1 gen 1967 anni
16.384
-6.056
-26.99%
1 gen 1968 anni
12.632
-3.753
-22.9%
1 gen 1969 anni
11.018
-1.613
-12.77%
1 gen 1970 anni
13.218
+2.2
19.97%
1 gen 1971 anni
15.1
+1.881
14.23%
1 gen 1972 anni
18.885
+3.785
25.07%
1 gen 1973 anni
20.686
+1.801
9.54%
1 gen 1974 anni
21.744
+1.058
5.12%
1 gen 1975 anni
16.383
-5.361
-24.66%
1 gen 1976 anni
27.664
+11.282
68.87%
1 gen 1977 anni
24.865
-2.8
-10.12%
1 gen 1978 anni
34.346
+9.481
38.13%
1 gen 1979 anni
52.688
+18.343
53.41%
1 gen 1980 anni
48.814
-3.874
-7.35%
1 gen 1981 anni
28.446
-20.367
-41.72%
1 gen 1982 anni
23.824
-4.622
-16.25%
1 gen 1983 anni
21.333
-2.491
-10.45%
1 gen 1984 anni
20.596
-0.737
-3.45%
1 gen 1985 anni
15.041
-5.555
-26.97%
1 gen 1986 anni
16.634
+1.592
10.59%
1 gen 1987 anni
18.83
+2.196
13.2%
1 gen 1988 anni
17.64
-1.19
-6.32%
1 gen 1989 anni
16.027
-1.613
-9.14%
1 gen 1990 anni
16.52
+0.493
3.07%
1 gen 1991 anni
26.571
+10.051
60.84%
1 gen 1992 anni
17.114
-9.457
-35.59%
1 gen 1993 anni
15.711
-1.402
-8.19%
1 gen 1994 anni
7.478
-8.233
-52.4%
1 gen 1995 anni
15.044
+7.566
101.17%
1 gen 1996 anni
16.13
+1.086
7.22%
1 gen 1997 anni
18.769
+2.639
16.36%
1 gen 1998 anni
16.287
-2.481
-13.22%
1 gen 1999 anni
16.437
+0.15
0.92%
1 gen 2000 anni
13.34
-3.097
-18.84%
1 gen 2001 anni
15.18
+1.84
13.79%
1 gen 2002 anni
15.613
+0.433
2.85%
1 gen 2003 anni
16.119
+0.506
3.24%
1 gen 2004 anni
14.428
-1.691
-10.49%
1 gen 2005 anni
14.515
+0.086
0.6%
1 gen 2006 anni
16.292
+1.777
12.25%
1 gen 2007 anni
16.775
+0.483
2.96%
1 gen 2008 anni
14.643
-2.132
-12.71%
1 gen 2009 anni
17.321
+2.679
18.3%
1 gen 2010 anni
17.985
+0.664
3.83%
1 gen 2011 anni
18.931
+0.946
5.26%
1 gen 2012 anni
18.259
-0.672
-3.55%
1 gen 2013 anni
24.192
+5.933
32.49%
1 gen 2014 anni
24.56
+0.368
1.52%
1 gen 2015 anni
23.143
-1.418
-5.77%
1 gen 2016 anni
20.735
-2.408
-10.4%
Classificazione dei paesi secondo i statistiche attuali per anni


Commenti: