29
/it/
it
AIzaSyAYiBZKx7MnpbEhh9jyipgxe19OcubqV5w
April 1, 2024
268026
Tunisia
TUN
true
2
1
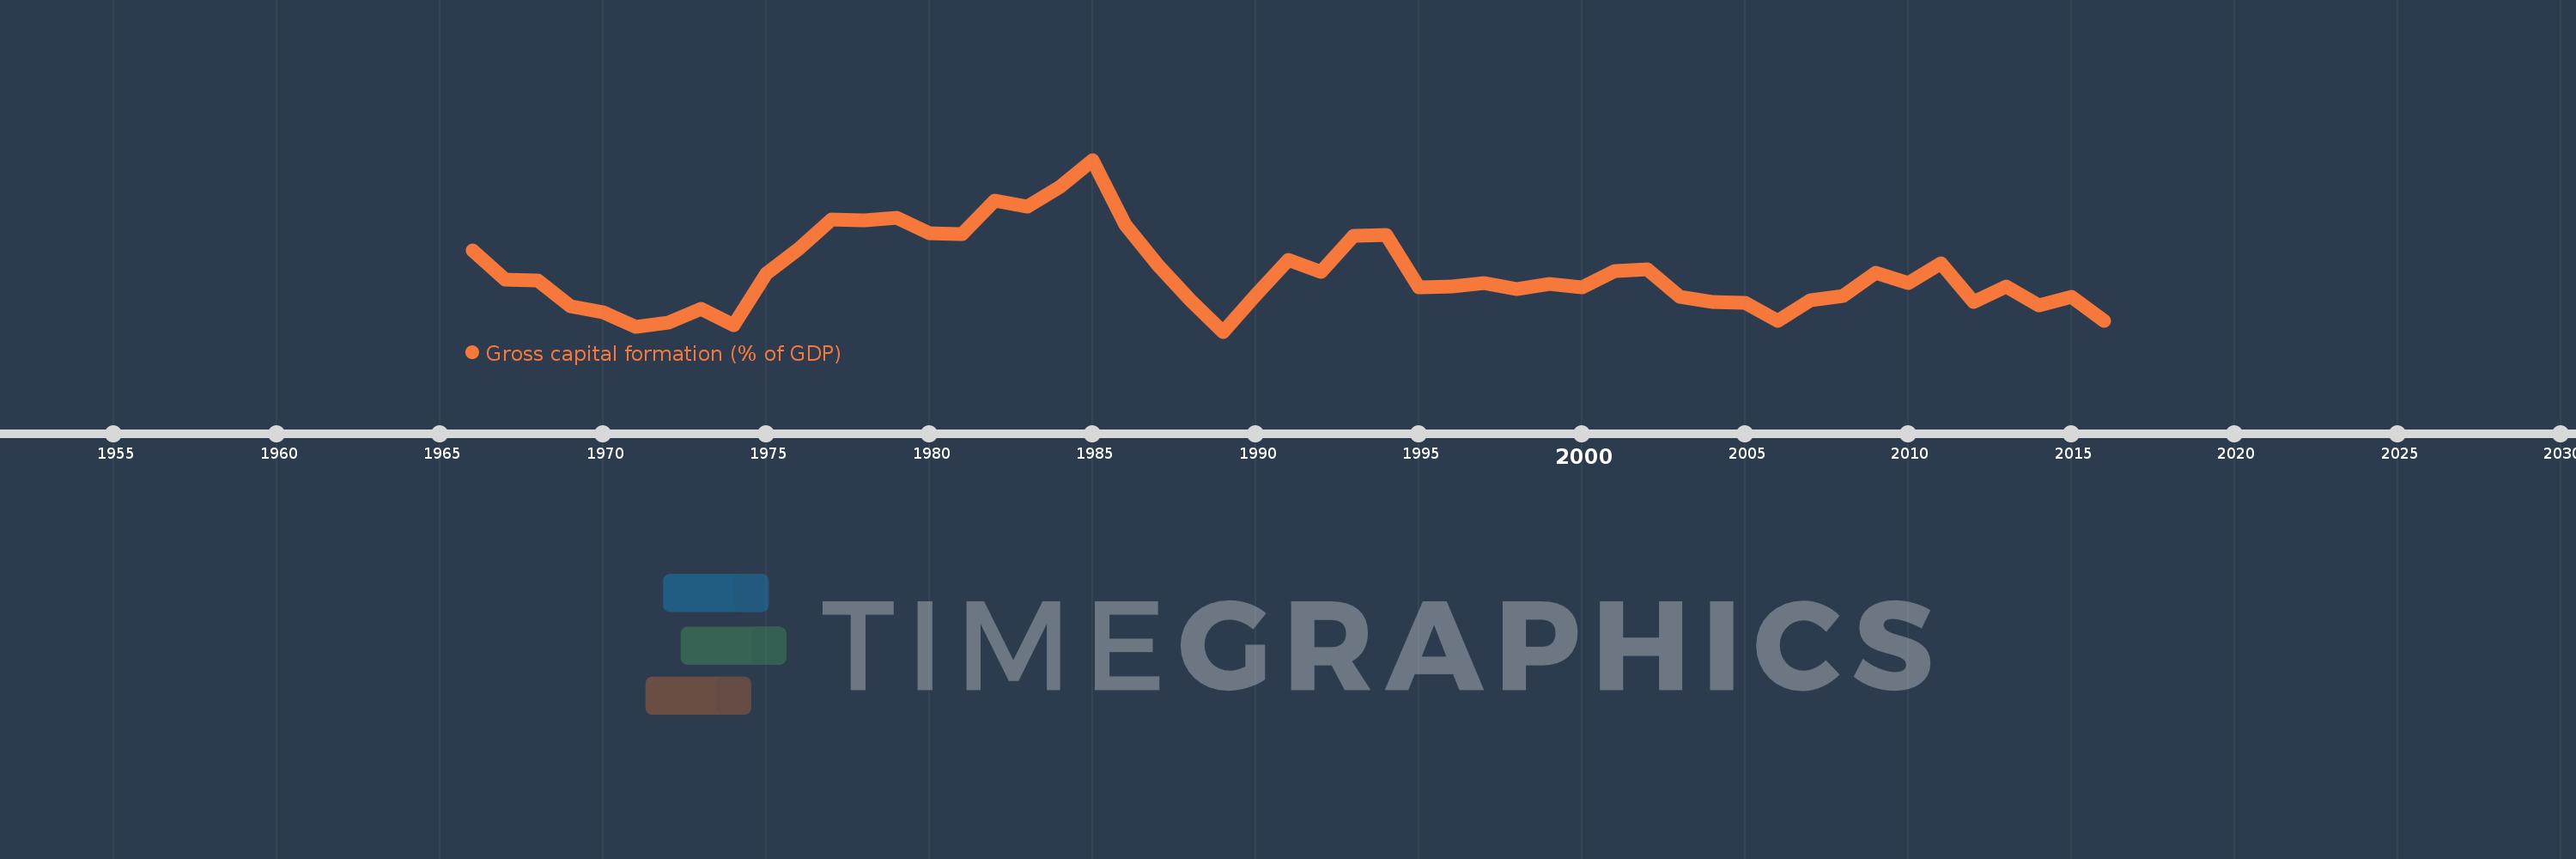
Gross capital formation (% of GDP)
2016,2015,2014,2013,2012,2011,2010,2009,2008,2007,2006,2005,2004,2003,2002,2001,2000,1999,1998,1997,1996,1995,1994,1993,1992,1991,1990,1989,1988,1987,1986,1985,1984,1983,1982,1981,1980,1979,1978,1977,1976,1975,1974,1973,1972,1971,1970,1969,1968,1967,1966
Queste statistiche in altri paesi:
AfghanistanAlbaniaAlgeriaAngolaAntigua and BarbudaArab WorldArgentinaArmeniaArubaAustraliaAustriaAzerbaijanBahamas, TheBahrainBangladeshBarbadosBelarusBelgiumBelizeBeninBermudaBhutanBoliviaBosnia and HerzegovinaBotswanaBrazilBrunei DarussalamBulgariaBurkina FasoBurundiCabo VerdeCambodiaCameroonCanadaCaribbean small statesCentral African RepublicCentral Europe and the BalticsChadChileChinaColombiaComorosCongo, Dem. Rep.Congo, Rep.Costa RicaCote d'IvoireCroatiaCubaCyprusCzech RepublicDenmarkDjiboutiDominicaDominican RepublicEarly-demographic dividendEast Asia & PacificEast Asia & Pacific (excluding high income)East Asia & Pacific (IDA & IBRD countries)EcuadorEgypt, Arab Rep.El SalvadorEquatorial GuineaEritreaEstoniaEthiopiaEuro areaEurope & Central AsiaEurope & Central Asia (excluding high income)Europe & Central Asia (IDA & IBRD countries)European UnionFaroe IslandsFijiFinlandFragile and conflict affected situationsFranceGabonGambia, TheGeorgiaGermanyGhanaGreeceGrenadaGuatemalaGuineaGuinea-BissauGuyanaHaitiHeavily indebted poor countries (HIPC)High incomeHondurasHong Kong SAR, ChinaHungaryIBRD onlyIcelandIDA & IBRD totalIDA blendIDA onlyIDA totalIndiaIndonesiaIran, Islamic Rep.IraqIrelandIsraelItalyJamaicaJapanJordanKazakhstanKenyaKiribatiKorea, Rep.KosovoKuwaitKyrgyz RepublicLao PDRLate-demographic dividendLatin America & Caribbean Latin America & Caribbean (excluding high income)Latin America & the Caribbean (IDA & IBRD countries)LatviaLeast developed countries: UN classificationLebanonLesothoLiberiaLibyaLithuaniaLow & middle incomeLow incomeLower middle incomeLuxembourgMacao SAR, ChinaMacedonia, FYRMadagascarMalawiMalaysiaMaldivesMaliMaltaMauritaniaMauritiusMexicoMicronesia, Fed. Sts.Middle East & North AfricaMiddle East & North Africa (excluding high income)Middle East & North Africa (IDA & IBRD countries)Middle incomeMoldovaMongoliaMontenegroMoroccoMozambiqueNamibiaNepalNetherlandsNew CaledoniaNew ZealandNicaraguaNigerNigeriaNorth AmericaNorwayOECD membersOmanOther small statesPacific island small statesPakistanPanamaPapua New GuineaParaguayPeruPhilippinesPolandPortugalPost-demographic dividendPre-demographic dividendPuerto RicoQatarRomaniaRussian FederationRwandaSaudi ArabiaSenegalSerbiaSeychellesSierra LeoneSingaporeSlovak RepublicSloveniaSmall statesSolomon IslandsSomaliaSouth AfricaSouth AsiaSouth Asia (IDA & IBRD)South SudanSpainSri LankaSt. Kitts and NevisSt. LuciaSt. Vincent and the GrenadinesSub-Saharan Africa Sub-Saharan Africa (excluding high income)Sub-Saharan Africa (IDA & IBRD countries)SudanSurinameSwazilandSwedenSwitzerlandSyrian Arab RepublicTajikistanTanzaniaThailandTimor-LesteTogoTongaTrinidad and TobagoTunisiaTurkeyTurkmenistanUgandaUkraineUnited Arab EmiratesUnited KingdomUnited StatesUpper middle incomeUruguayUzbekistanVanuatuVenezuela, RBVietnamWest Bank and GazaWorldYemen, Rep.ZambiaZimbabwe Linea del tempo:
Questa scala temporale mostra un grafico dal 1966 anno al 2016 anno. Tunisia. I dati fino ad 1965 anno non disponibili. Il numero di osservazioni attuali secondo i date: 51.
La fonte (nome):
Indicatori dello sviluppo mondiale
La fonte (organizzazione):
World Bank national accounts data, and OECD National Accounts data files.
Categorie:
Economy & Growth
sono stati aggiornati
23 apr 2017 anni
Indicatori delle variazioni dei valori per anni
Minima:
20.71
1 gen 1989 anni
Massimo:
35.899
1 gen 1985 anni
Alla data di osservazione
Valore
Variazione assoluta
La variazione rispetto al valore precedente
1 gen 1966 anni
27.907
+27.907
0.0%
1 gen 1967 anni
25.288
-2.619
-9.38%
1 gen 1968 anni
25.193
-0.095
-0.38%
1 gen 1969 anni
22.926
-2.267
-9.0%
1 gen 1970 anni
22.445
-0.481
-2.1%
1 gen 1971 anni
21.149
-1.297
-5.78%
1 gen 1972 anni
21.516
+0.367
1.74%
1 gen 1973 anni
22.717
+1.201
5.58%
1 gen 1974 anni
21.28
-1.436
-6.32%
1 gen 1975 anni
25.804
+4.524
21.26%
1 gen 1976 anni
28.018
+2.213
8.58%
1 gen 1977 anni
30.657
+2.639
9.42%
1 gen 1978 anni
30.544
-0.113
-0.37%
1 gen 1979 anni
30.758
+0.214
0.7%
1 gen 1980 anni
29.428
-1.33
-4.32%
1 gen 1981 anni
29.36
-0.068
-0.23%
1 gen 1982 anni
32.328
+2.968
10.11%
1 gen 1983 anni
31.727
-0.601
-1.86%
1 gen 1984 anni
33.496
+1.769
5.58%
1 gen 1985 anni
35.899
+2.403
7.17%
1 gen 1986 anni
30.163
-5.737
-15.98%
1 gen 1987 anni
26.6
-3.562
-11.81%
1 gen 1988 anni
23.484
-3.117
-11.72%
1 gen 1989 anni
20.71
-2.774
-11.81%
1 gen 1990 anni
23.912
+3.202
15.46%
1 gen 1991 anni
27.068
+3.156
13.2%
1 gen 1992 anni
25.988
-1.08
-3.99%
1 gen 1993 anni
29.194
+3.206
12.34%
1 gen 1994 anni
29.24
+0.045
0.16%
1 gen 1995 anni
24.644
-4.595
-15.72%
1 gen 1996 anni
24.701
+0.056
0.23%
1 gen 1997 anni
25.014
+0.313
1.27%
1 gen 1998 anni
24.459
-0.555
-2.22%
1 gen 1999 anni
24.917
+0.458
1.87%
1 gen 2000 anni
24.62
-0.297
-1.19%
1 gen 2001 anni
26.083
+1.462
5.94%
1 gen 2002 anni
26.179
+0.097
0.37%
1 gen 2003 anni
23.811
-2.369
-9.05%
1 gen 2004 anni
23.323
-0.487
-2.05%
1 gen 2005 anni
23.278
-0.045
-0.19%
1 gen 2006 anni
21.679
-1.599
-6.87%
1 gen 2007 anni
23.449
+1.769
8.16%
1 gen 2008 anni
23.836
+0.387
1.65%
1 gen 2009 anni
25.942
+2.106
8.83%
1 gen 2010 anni
24.995
-0.946
-3.65%
1 gen 2011 anni
26.712
+1.717
6.87%
1 gen 2012 anni
23.342
-3.37
-12.62%
1 gen 2013 anni
24.693
+1.351
5.79%
1 gen 2014 anni
23.0
-1.693
-6.86%
1 gen 2015 anni
23.794
+0.794
3.45%
1 gen 2016 anni
21.643
-2.151
-9.04%
Classificazione dei paesi secondo i statistiche attuali per anni


Commenti: