29
/it/
it
AIzaSyAYiBZKx7MnpbEhh9jyipgxe19OcubqV5w
April 1, 2024
151617
Hong Kong SAR, China
HKG
true
2
1
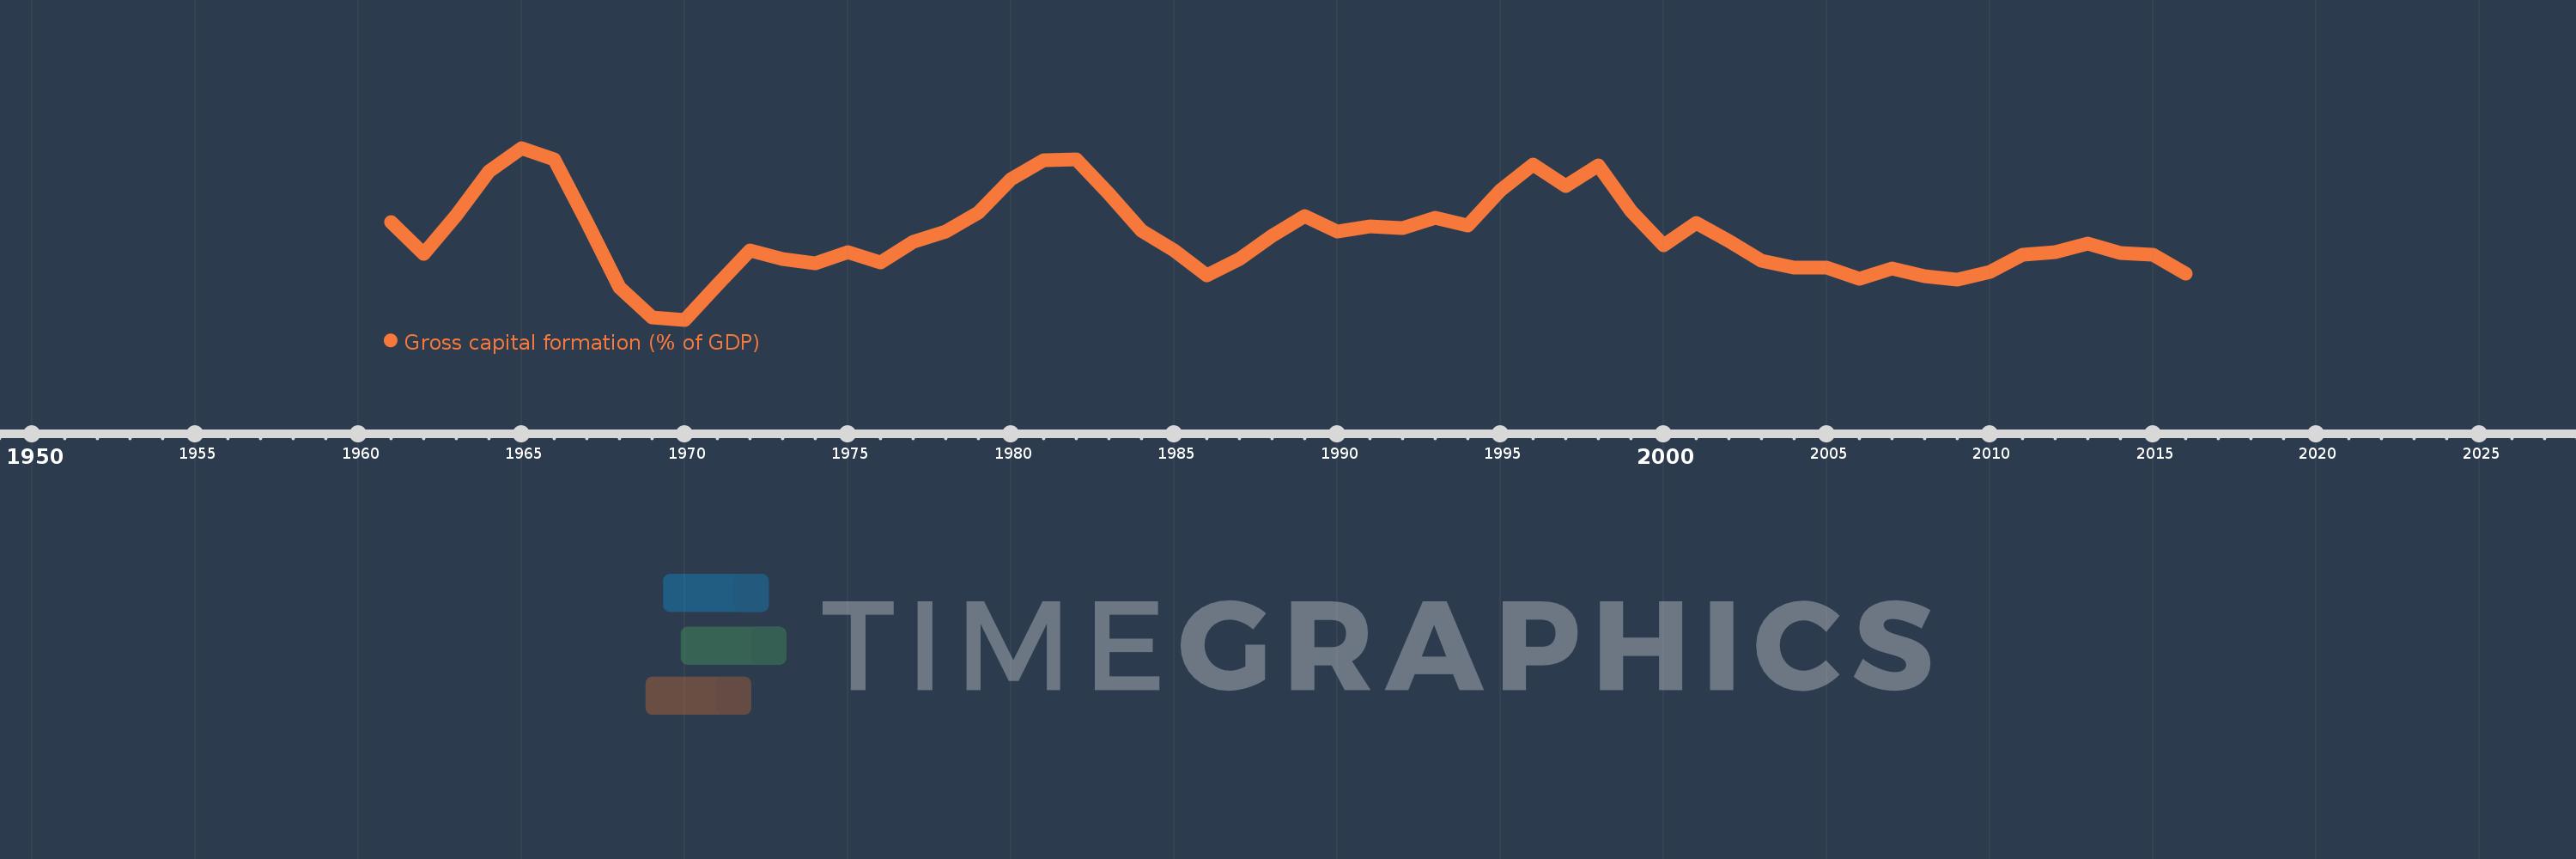
Gross capital formation (% of GDP)
2016,2015,2014,2013,2012,2011,2010,2009,2008,2007,2006,2005,2004,2003,2002,2001,2000,1999,1998,1997,1996,1995,1994,1993,1992,1991,1990,1989,1988,1987,1986,1985,1984,1983,1982,1981,1980,1979,1978,1977,1976,1975,1974,1973,1972,1971,1970,1969,1968,1967,1966,1965,1964,1963,1962,1961
Queste statistiche in altri paesi:
AfghanistanAlbaniaAlgeriaAngolaAntigua and BarbudaArab WorldArgentinaArmeniaArubaAustraliaAustriaAzerbaijanBahamas, TheBahrainBangladeshBarbadosBelarusBelgiumBelizeBeninBermudaBhutanBoliviaBosnia and HerzegovinaBotswanaBrazilBrunei DarussalamBulgariaBurkina FasoBurundiCabo VerdeCambodiaCameroonCanadaCaribbean small statesCentral African RepublicCentral Europe and the BalticsChadChileChinaColombiaComorosCongo, Dem. Rep.Congo, Rep.Costa RicaCote d'IvoireCroatiaCubaCyprusCzech RepublicDenmarkDjiboutiDominicaDominican RepublicEarly-demographic dividendEast Asia & PacificEast Asia & Pacific (excluding high income)East Asia & Pacific (IDA & IBRD countries)EcuadorEgypt, Arab Rep.El SalvadorEquatorial GuineaEritreaEstoniaEthiopiaEuro areaEurope & Central AsiaEurope & Central Asia (excluding high income)Europe & Central Asia (IDA & IBRD countries)European UnionFaroe IslandsFijiFinlandFragile and conflict affected situationsFranceGabonGambia, TheGeorgiaGermanyGhanaGreeceGrenadaGuatemalaGuineaGuinea-BissauGuyanaHaitiHeavily indebted poor countries (HIPC)High incomeHondurasHong Kong SAR, ChinaHungaryIBRD onlyIcelandIDA & IBRD totalIDA blendIDA onlyIDA totalIndiaIndonesiaIran, Islamic Rep.IraqIrelandIsraelItalyJamaicaJapanJordanKazakhstanKenyaKiribatiKorea, Rep.KosovoKuwaitKyrgyz RepublicLao PDRLate-demographic dividendLatin America & Caribbean Latin America & Caribbean (excluding high income)Latin America & the Caribbean (IDA & IBRD countries)LatviaLeast developed countries: UN classificationLebanonLesothoLiberiaLibyaLithuaniaLow & middle incomeLow incomeLower middle incomeLuxembourgMacao SAR, ChinaMacedonia, FYRMadagascarMalawiMalaysiaMaldivesMaliMaltaMauritaniaMauritiusMexicoMicronesia, Fed. Sts.Middle East & North AfricaMiddle East & North Africa (excluding high income)Middle East & North Africa (IDA & IBRD countries)Middle incomeMoldovaMongoliaMontenegroMoroccoMozambiqueNamibiaNepalNetherlandsNew CaledoniaNew ZealandNicaraguaNigerNigeriaNorth AmericaNorwayOECD membersOmanOther small statesPacific island small statesPakistanPanamaPapua New GuineaParaguayPeruPhilippinesPolandPortugalPost-demographic dividendPre-demographic dividendPuerto RicoQatarRomaniaRussian FederationRwandaSaudi ArabiaSenegalSerbiaSeychellesSierra LeoneSingaporeSlovak RepublicSloveniaSmall statesSolomon IslandsSomaliaSouth AfricaSouth AsiaSouth Asia (IDA & IBRD)South SudanSpainSri LankaSt. Kitts and NevisSt. LuciaSt. Vincent and the GrenadinesSub-Saharan Africa Sub-Saharan Africa (excluding high income)Sub-Saharan Africa (IDA & IBRD countries)SudanSurinameSwazilandSwedenSwitzerlandSyrian Arab RepublicTajikistanTanzaniaThailandTimor-LesteTogoTongaTrinidad and TobagoTunisiaTurkeyTurkmenistanUgandaUkraineUnited Arab EmiratesUnited KingdomUnited StatesUpper middle incomeUruguayUzbekistanVanuatuVenezuela, RBVietnamWest Bank and GazaWorldYemen, Rep.ZambiaZimbabwe Linea del tempo:
Questa scala temporale mostra un grafico dal 1961 anno al 2016 anno. Hong Kong SAR, China. I dati fino ad 1960 anno non disponibili. Il numero di osservazioni attuali secondo i date: 56.
La fonte (nome):
Indicatori dello sviluppo mondiale
La fonte (organizzazione):
World Bank national accounts data, and OECD National Accounts data files.
Categorie:
Economy & Growth
sono stati aggiornati
23 apr 2017 anni
Indicatori delle variazioni dei valori per anni
Minima:
16.355
1 gen 1970 anni
Massimo:
36.247
1 gen 1965 anni
Alla data di osservazione
Valore
Variazione assoluta
La variazione rispetto al valore precedente
1 gen 1961 anni
27.689
+27.689
0.0%
1 gen 1962 anni
23.984
-3.705
-13.38%
1 gen 1963 anni
28.445
+4.461
18.6%
1 gen 1964 anni
33.49
+5.045
17.74%
1 gen 1965 anni
36.247
+2.757
8.23%
1 gen 1966 anni
34.896
-1.351
-3.73%
1 gen 1967 anni
27.643
-7.253
-20.78%
1 gen 1968 anni
20.11
-7.533
-27.25%
1 gen 1969 anni
16.615
-3.495
-17.38%
1 gen 1970 anni
16.355
-0.26
-1.56%
1 gen 1971 anni
20.406
+4.051
24.77%
1 gen 1972 anni
24.343
+3.937
19.29%
1 gen 1973 anni
23.419
-0.924
-3.8%
1 gen 1974 anni
22.883
-0.536
-2.29%
1 gen 1975 anni
24.183
+1.3
5.68%
1 gen 1976 anni
22.947
-1.236
-5.11%
1 gen 1977 anni
25.382
+2.435
10.61%
1 gen 1978 anni
26.521
+1.14
4.49%
1 gen 1979 anni
28.73
+2.208
8.33%
1 gen 1980 anni
32.635
+3.905
13.59%
1 gen 1981 anni
34.853
+2.218
6.8%
1 gen 1982 anni
34.939
+0.086
0.25%
1 gen 1983 anni
30.983
-3.956
-11.32%
1 gen 1984 anni
26.67
-4.314
-13.92%
1 gen 1985 anni
24.418
-2.252
-8.44%
1 gen 1986 anni
21.5
-2.918
-11.95%
1 gen 1987 anni
23.432
+1.932
8.99%
1 gen 1988 anni
26.068
+2.635
11.25%
1 gen 1989 anni
28.352
+2.284
8.76%
1 gen 1990 anni
26.524
-1.829
-6.45%
1 gen 1991 anni
27.171
+0.647
2.44%
1 gen 1992 anni
26.921
-0.249
-0.92%
1 gen 1993 anni
28.177
+1.255
4.66%
1 gen 1994 anni
27.25
-0.927
-3.29%
1 gen 1995 anni
31.379
+4.129
15.15%
1 gen 1996 anni
34.291
+2.911
9.28%
1 gen 1997 anni
31.8
-2.49
-7.26%
1 gen 1998 anni
34.2
+2.4
7.55%
1 gen 1999 anni
29.004
-5.196
-15.19%
1 gen 2000 anni
24.98
-4.024
-13.88%
1 gen 2001 anni
27.582
+2.603
10.42%
1 gen 2002 anni
25.491
-2.091
-7.58%
1 gen 2003 anni
23.181
-2.31
-9.06%
1 gen 2004 anni
22.38
-0.801
-3.46%
1 gen 2005 anni
22.357
-0.022
-0.1%
1 gen 2006 anni
21.06
-1.298
-5.8%
1 gen 2007 anni
22.285
+1.225
5.82%
1 gen 2008 anni
21.396
-0.889
-3.99%
1 gen 2009 anni
21.041
-0.355
-1.66%
1 gen 2010 anni
21.847
+0.806
3.83%
1 gen 2011 anni
23.89
+2.044
9.35%
1 gen 2012 anni
24.143
+0.253
1.06%
1 gen 2013 anni
25.22
+1.077
4.46%
1 gen 2014 anni
24.034
-1.186
-4.7%
1 gen 2015 anni
23.844
-0.189
-0.79%
1 gen 2016 anni
21.702
-2.143
-8.99%
Classificazione dei paesi secondo i statistiche attuali per anni


Commenti: