29
/it/
it
AIzaSyAYiBZKx7MnpbEhh9jyipgxe19OcubqV5w
April 1, 2024
31163
Europe & Central Asia
ECS
false
2
1
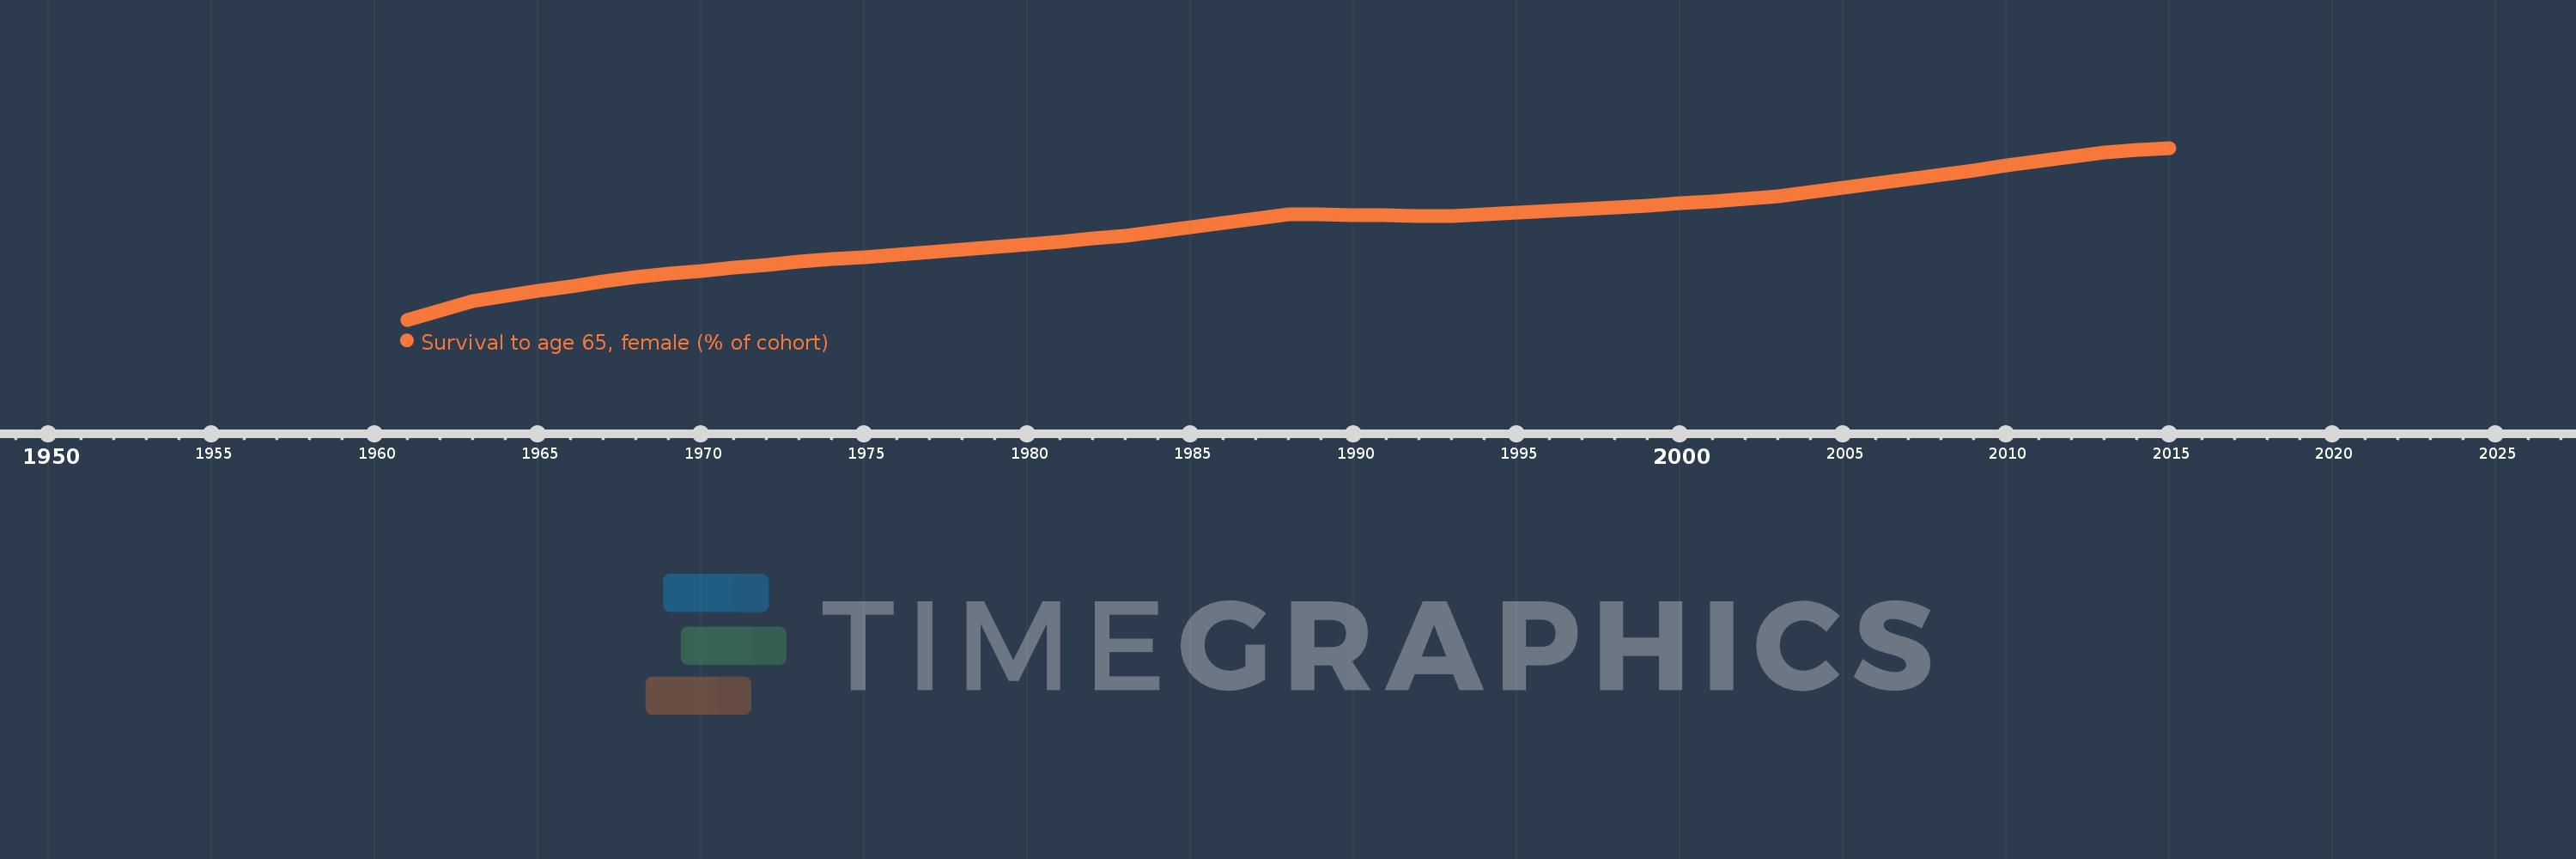
Survival to age 65, female (% of cohort)
2015,2014,2013,2012,2011,2010,2009,2008,2007,2006,2005,2004,2003,2002,2001,2000,1999,1998,1997,1996,1995,1994,1993,1992,1991,1990,1989,1988,1987,1986,1985,1984,1983,1982,1981,1980,1979,1978,1977,1976,1975,1974,1973,1972,1971,1970,1969,1968,1967,1966,1965,1964,1963,1962,1961
Queste statistiche in altri paesi:
AfghanistanAlbaniaAlgeriaAngolaAntigua and BarbudaArab WorldArgentinaArmeniaArubaAustraliaAustriaAzerbaijanBahamas, TheBahrainBangladeshBarbadosBelarusBelgiumBelizeBeninBhutanBoliviaBosnia and HerzegovinaBotswanaBrazilBrunei DarussalamBulgariaBurkina FasoBurundiCabo VerdeCambodiaCameroonCanadaCaribbean small statesCentral African RepublicCentral Europe and the BalticsChadChannel IslandsChileChinaColombiaComorosCongo, Dem. Rep.Congo, Rep.Costa RicaCote d'IvoireCroatiaCubaCuracaoCyprusCzech RepublicDenmarkDjiboutiDominican RepublicEarly-demographic dividendEast Asia & PacificEast Asia & Pacific (excluding high income)East Asia & Pacific (IDA & IBRD countries)EcuadorEgypt, Arab Rep.El SalvadorEquatorial GuineaEritreaEstoniaEthiopiaEuro areaEurope & Central AsiaEurope & Central Asia (excluding high income)Europe & Central Asia (IDA & IBRD countries)European UnionFijiFinlandFragile and conflict affected situationsFranceFrench PolynesiaGabonGambia, TheGeorgiaGermanyGhanaGreeceGrenadaGuamGuatemalaGuineaGuinea-BissauGuyanaHaitiHeavily indebted poor countries (HIPC)High incomeHondurasHong Kong SAR, ChinaHungaryIBRD onlyIcelandIDA & IBRD totalIDA blendIDA onlyIDA totalIndiaIndonesiaIran, Islamic Rep.IraqIrelandIsraelItalyJamaicaJapanJordanKazakhstanKenyaKiribatiKorea, Dem. People’s Rep.Korea, Rep.KuwaitKyrgyz RepublicLao PDRLate-demographic dividendLatin America & Caribbean Latin America & Caribbean (excluding high income)Latin America & the Caribbean (IDA & IBRD countries)LatviaLeast developed countries: UN classificationLebanonLesothoLiberiaLibyaLithuaniaLow & middle incomeLow incomeLower middle incomeLuxembourgMacao SAR, ChinaMacedonia, FYRMadagascarMalawiMalaysiaMaldivesMaliMaltaMauritaniaMauritiusMexicoMicronesia, Fed. Sts.Middle East & North AfricaMiddle East & North Africa (excluding high income)Middle East & North Africa (IDA & IBRD countries)Middle incomeMoldovaMongoliaMontenegroMoroccoMozambiqueMyanmarNamibiaNepalNetherlandsNew CaledoniaNew ZealandNicaraguaNigerNigeriaNorth AmericaNorwayOECD membersOmanOther small statesPacific island small statesPakistanPanamaPapua New GuineaParaguayPeruPhilippinesPolandPortugalPost-demographic dividendPre-demographic dividendPuerto RicoQatarRomaniaRussian FederationRwandaSamoaSao Tome and PrincipeSaudi ArabiaSenegalSerbiaSeychellesSierra LeoneSingaporeSlovak RepublicSloveniaSmall statesSolomon IslandsSomaliaSouth AfricaSouth AsiaSouth Asia (IDA & IBRD)South SudanSpainSri LankaSt. LuciaSt. Vincent and the GrenadinesSub-Saharan Africa Sub-Saharan Africa (excluding high income)Sub-Saharan Africa (IDA & IBRD countries)SudanSurinameSwazilandSwedenSwitzerlandSyrian Arab RepublicTajikistanTanzaniaThailandTimor-LesteTogoTongaTrinidad and TobagoTunisiaTurkeyTurkmenistanUgandaUkraineUnited Arab EmiratesUnited KingdomUnited StatesUpper middle incomeUruguayUzbekistanVanuatuVenezuela, RBVietnamVirgin Islands (U.S.)West Bank and GazaWorldYemen, Rep.ZambiaZimbabwe Linea del tempo:
Questa scala temporale mostra un grafico dal 1961 anno al 2015 anno. Europe & Central Asia. I dati fino ad 1960 anno non disponibili. Il numero di osservazioni attuali secondo i date: 55.
La fonte (nome):
Indicatori dello sviluppo mondiale
La fonte (organizzazione):
United Nations Population Division. World Population Prospects. New York, United Nations, Department of Economic and Social Affairs (advanced Excel tables). Available at http://esa.un.org/wpp/unpp/panel_population.htm.
Categorie:
Health, Gender
sono stati aggiornati
23 apr 2017 anni
Indicatori delle variazioni dei valori per anni
Minima:
76.342
1 gen 1961 anni
Massimo:
87.676
1 gen 2015 anni
Alla data di osservazione
Valore
Variazione assoluta
La variazione rispetto al valore precedente
1 gen 1961 anni
76.342
+76.342
0.0%
1 gen 1962 anni
76.966
+0.624
0.82%
1 gen 1963 anni
77.597
+0.631
0.82%
1 gen 1964 anni
77.917
+0.32
0.41%
1 gen 1965 anni
78.234
+0.317
0.41%
1 gen 1966 anni
78.545
+0.311
0.4%
1 gen 1967 anni
78.853
+0.308
0.39%
1 gen 1968 anni
79.155
+0.302
0.38%
1 gen 1969 anni
79.359
+0.204
0.26%
1 gen 1970 anni
79.563
+0.205
0.26%
1 gen 1971 anni
79.77
+0.206
0.26%
1 gen 1972 anni
79.98
+0.21
0.26%
1 gen 1973 anni
80.193
+0.214
0.27%
1 gen 1974 anni
80.341
+0.148
0.18%
1 gen 1975 anni
80.49
+0.149
0.19%
1 gen 1976 anni
80.639
+0.149
0.19%
1 gen 1977 anni
80.793
+0.153
0.19%
1 gen 1978 anni
80.947
+0.155
0.19%
1 gen 1979 anni
81.129
+0.182
0.22%
1 gen 1980 anni
81.314
+0.185
0.23%
1 gen 1981 anni
81.505
+0.19
0.23%
1 gen 1982 anni
81.697
+0.192
0.24%
1 gen 1983 anni
81.892
+0.196
0.24%
1 gen 1984 anni
82.177
+0.284
0.35%
1 gen 1985 anni
82.459
+0.282
0.34%
1 gen 1986 anni
82.739
+0.28
0.34%
1 gen 1987 anni
83.019
+0.281
0.34%
1 gen 1988 anni
83.299
+0.279
0.34%
1 gen 1989 anni
83.269
-0.03
-0.04%
1 gen 1990 anni
83.241
-0.028
-0.03%
1 gen 1991 anni
83.22
-0.021
-0.03%
1 gen 1992 anni
83.203
-0.017
-0.02%
1 gen 1993 anni
83.191
-0.012
-0.01%
1 gen 1994 anni
83.302
+0.11
0.13%
1 gen 1995 anni
83.412
+0.111
0.13%
1 gen 1996 anni
83.52
+0.108
0.13%
1 gen 1997 anni
83.622
+0.101
0.12%
1 gen 1998 anni
83.723
+0.102
0.12%
1 gen 1999 anni
83.862
+0.139
0.17%
1 gen 2000 anni
84.004
+0.142
0.17%
1 gen 2001 anni
84.147
+0.143
0.17%
1 gen 2002 anni
84.305
+0.158
0.19%
1 gen 2003 anni
84.467
+0.162
0.19%
1 gen 2004 anni
84.757
+0.29
0.34%
1 gen 2005 anni
85.045
+0.288
0.34%
1 gen 2006 anni
85.331
+0.285
0.34%
1 gen 2007 anni
85.617
+0.286
0.34%
1 gen 2008 anni
85.9
+0.284
0.33%
1 gen 2009 anni
86.205
+0.304
0.35%
1 gen 2010 anni
86.503
+0.299
0.35%
1 gen 2011 anni
86.801
+0.298
0.34%
1 gen 2012 anni
87.101
+0.3
0.35%
1 gen 2013 anni
87.398
+0.297
0.34%
1 gen 2014 anni
87.542
+0.145
0.17%
1 gen 2015 anni
87.676
+0.133
0.15%
Classificazione dei paesi secondo i statistiche attuali per anni


Commenti: