29
/it/
it
AIzaSyAYiBZKx7MnpbEhh9jyipgxe19OcubqV5w
April 1, 2024
240983
Singapore
SGP
true
2
1
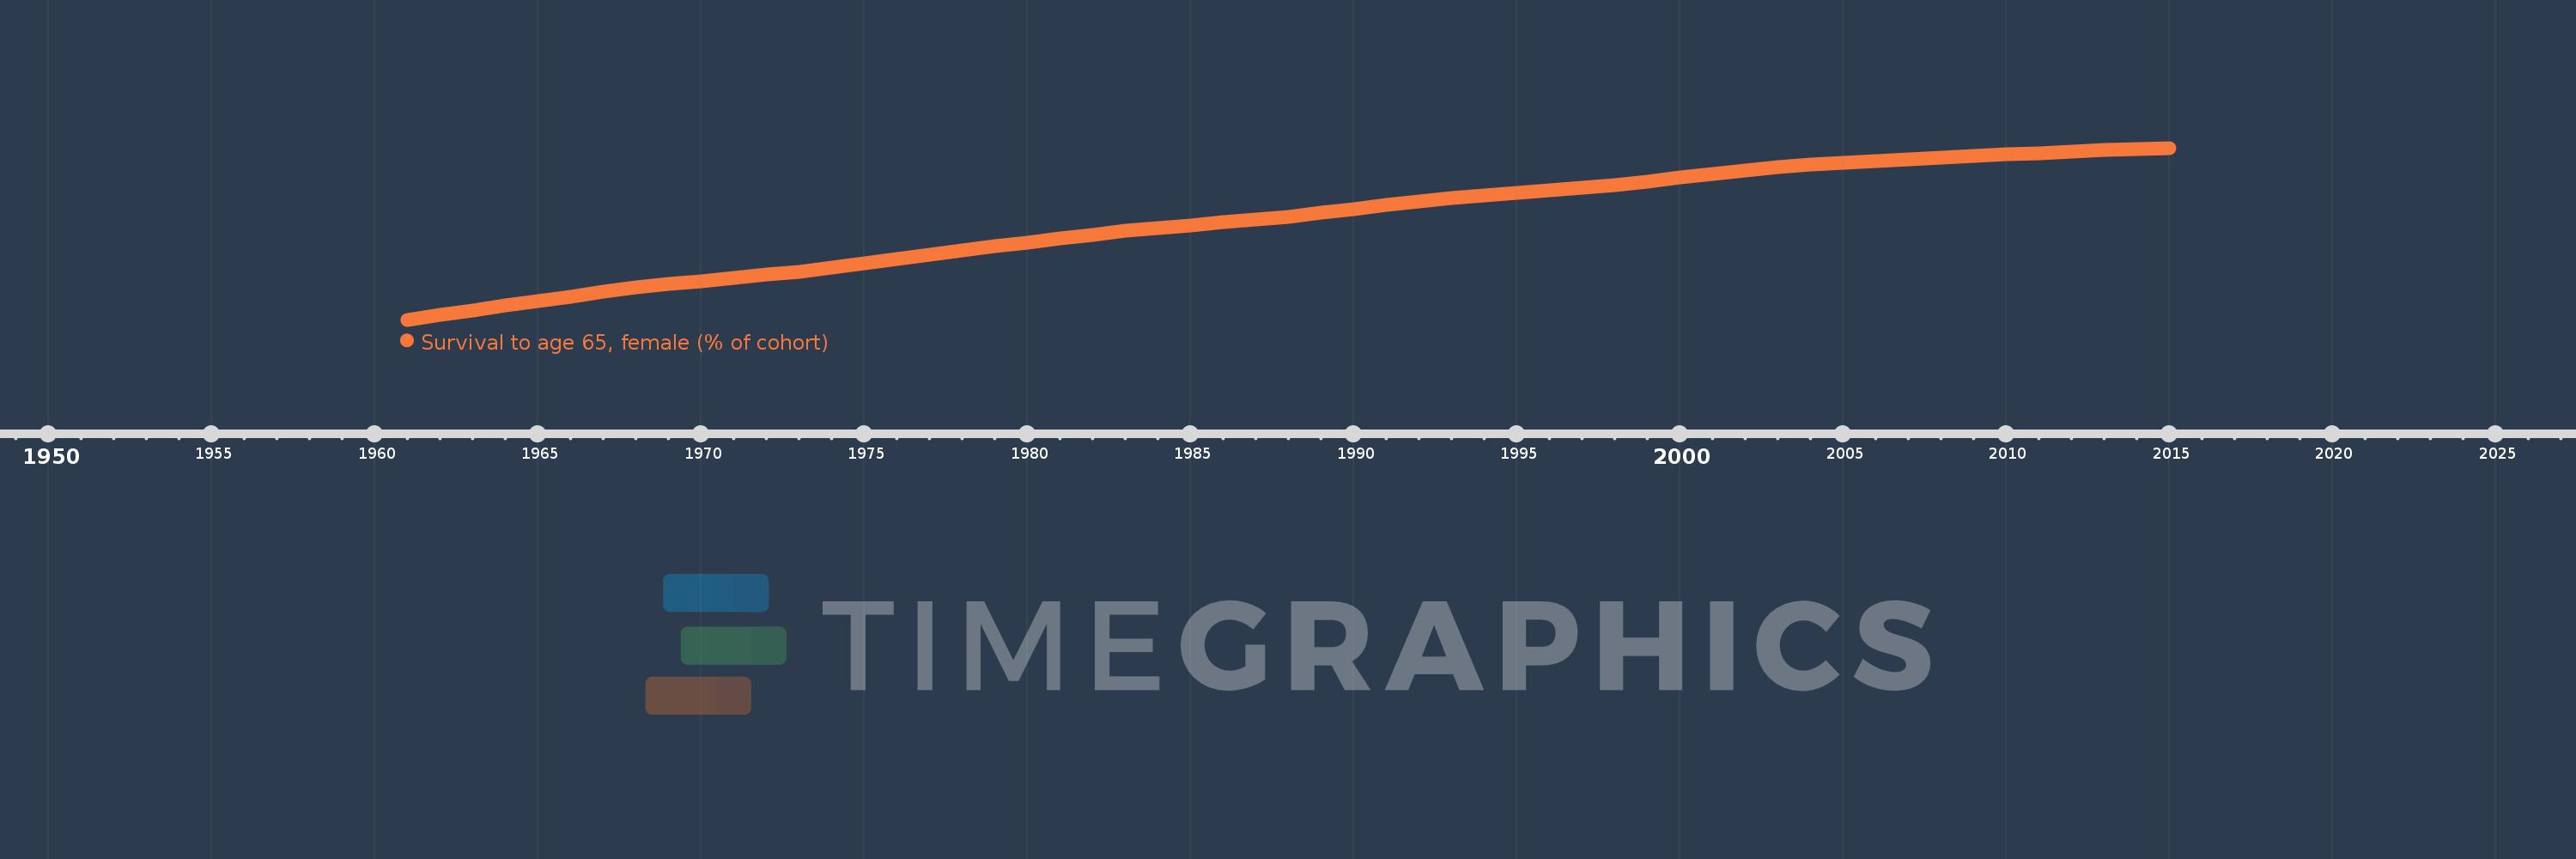
Survival to age 65, female (% of cohort)
2015,2014,2013,2012,2011,2010,2009,2008,2007,2006,2005,2004,2003,2002,2001,2000,1999,1998,1997,1996,1995,1994,1993,1992,1991,1990,1989,1988,1987,1986,1985,1984,1983,1982,1981,1980,1979,1978,1977,1976,1975,1974,1973,1972,1971,1970,1969,1968,1967,1966,1965,1964,1963,1962,1961
Queste statistiche in altri paesi:
AfghanistanAlbaniaAlgeriaAngolaAntigua and BarbudaArab WorldArgentinaArmeniaArubaAustraliaAustriaAzerbaijanBahamas, TheBahrainBangladeshBarbadosBelarusBelgiumBelizeBeninBhutanBoliviaBosnia and HerzegovinaBotswanaBrazilBrunei DarussalamBulgariaBurkina FasoBurundiCabo VerdeCambodiaCameroonCanadaCaribbean small statesCentral African RepublicCentral Europe and the BalticsChadChannel IslandsChileChinaColombiaComorosCongo, Dem. Rep.Congo, Rep.Costa RicaCote d'IvoireCroatiaCubaCuracaoCyprusCzech RepublicDenmarkDjiboutiDominican RepublicEarly-demographic dividendEast Asia & PacificEast Asia & Pacific (excluding high income)East Asia & Pacific (IDA & IBRD countries)EcuadorEgypt, Arab Rep.El SalvadorEquatorial GuineaEritreaEstoniaEthiopiaEuro areaEurope & Central AsiaEurope & Central Asia (excluding high income)Europe & Central Asia (IDA & IBRD countries)European UnionFijiFinlandFragile and conflict affected situationsFranceFrench PolynesiaGabonGambia, TheGeorgiaGermanyGhanaGreeceGrenadaGuamGuatemalaGuineaGuinea-BissauGuyanaHaitiHeavily indebted poor countries (HIPC)High incomeHondurasHong Kong SAR, ChinaHungaryIBRD onlyIcelandIDA & IBRD totalIDA blendIDA onlyIDA totalIndiaIndonesiaIran, Islamic Rep.IraqIrelandIsraelItalyJamaicaJapanJordanKazakhstanKenyaKiribatiKorea, Dem. People’s Rep.Korea, Rep.KuwaitKyrgyz RepublicLao PDRLate-demographic dividendLatin America & Caribbean Latin America & Caribbean (excluding high income)Latin America & the Caribbean (IDA & IBRD countries)LatviaLeast developed countries: UN classificationLebanonLesothoLiberiaLibyaLithuaniaLow & middle incomeLow incomeLower middle incomeLuxembourgMacao SAR, ChinaMacedonia, FYRMadagascarMalawiMalaysiaMaldivesMaliMaltaMauritaniaMauritiusMexicoMicronesia, Fed. Sts.Middle East & North AfricaMiddle East & North Africa (excluding high income)Middle East & North Africa (IDA & IBRD countries)Middle incomeMoldovaMongoliaMontenegroMoroccoMozambiqueMyanmarNamibiaNepalNetherlandsNew CaledoniaNew ZealandNicaraguaNigerNigeriaNorth AmericaNorwayOECD membersOmanOther small statesPacific island small statesPakistanPanamaPapua New GuineaParaguayPeruPhilippinesPolandPortugalPost-demographic dividendPre-demographic dividendPuerto RicoQatarRomaniaRussian FederationRwandaSamoaSao Tome and PrincipeSaudi ArabiaSenegalSerbiaSeychellesSierra LeoneSingaporeSlovak RepublicSloveniaSmall statesSolomon IslandsSomaliaSouth AfricaSouth AsiaSouth Asia (IDA & IBRD)South SudanSpainSri LankaSt. LuciaSt. Vincent and the GrenadinesSub-Saharan Africa Sub-Saharan Africa (excluding high income)Sub-Saharan Africa (IDA & IBRD countries)SudanSurinameSwazilandSwedenSwitzerlandSyrian Arab RepublicTajikistanTanzaniaThailandTimor-LesteTogoTongaTrinidad and TobagoTunisiaTurkeyTurkmenistanUgandaUkraineUnited Arab EmiratesUnited KingdomUnited StatesUpper middle incomeUruguayUzbekistanVanuatuVenezuela, RBVietnamVirgin Islands (U.S.)West Bank and GazaWorldYemen, Rep.ZambiaZimbabwe Linea del tempo:
Questa scala temporale mostra un grafico dal 1961 anno al 2015 anno. Singapore. I dati fino ad 1960 anno non disponibili. Il numero di osservazioni attuali secondo i date: 55.
La fonte (nome):
Indicatori dello sviluppo mondiale
La fonte (organizzazione):
United Nations Population Division. World Population Prospects. New York, United Nations, Department of Economic and Social Affairs (advanced Excel tables). Available at http://esa.un.org/wpp/unpp/panel_population.htm.
Categorie:
Health, Gender
sono stati aggiornati
23 apr 2017 anni
Indicatori delle variazioni dei valori per anni
Minima:
71.301
1 gen 1961 anni
Massimo:
93.536
1 gen 2015 anni
Alla data di osservazione
Valore
Variazione assoluta
La variazione rispetto al valore precedente
1 gen 1961 anni
71.301
+71.301
0.0%
1 gen 1962 anni
71.92
+0.619
0.87%
1 gen 1963 anni
72.539
+0.619
0.86%
1 gen 1964 anni
73.133
+0.594
0.82%
1 gen 1965 anni
73.726
+0.594
0.81%
1 gen 1966 anni
74.32
+0.594
0.81%
1 gen 1967 anni
74.913
+0.594
0.8%
1 gen 1968 anni
75.507
+0.594
0.79%
1 gen 1969 anni
75.91
+0.403
0.53%
1 gen 1970 anni
76.313
+0.403
0.53%
1 gen 1971 anni
76.716
+0.403
0.53%
1 gen 1972 anni
77.119
+0.403
0.53%
1 gen 1973 anni
77.522
+0.403
0.52%
1 gen 1974 anni
78.078
+0.556
0.72%
1 gen 1975 anni
78.635
+0.556
0.71%
1 gen 1976 anni
79.191
+0.556
0.71%
1 gen 1977 anni
79.748
+0.556
0.7%
1 gen 1978 anni
80.304
+0.556
0.7%
1 gen 1979 anni
80.806
+0.502
0.63%
1 gen 1980 anni
81.308
+0.502
0.62%
1 gen 1981 anni
81.81
+0.502
0.62%
1 gen 1982 anni
82.312
+0.502
0.61%
1 gen 1983 anni
82.814
+0.502
0.61%
1 gen 1984 anni
83.179
+0.366
0.44%
1 gen 1985 anni
83.545
+0.366
0.44%
1 gen 1986 anni
83.911
+0.366
0.44%
1 gen 1987 anni
84.277
+0.366
0.44%
1 gen 1988 anni
84.643
+0.366
0.43%
1 gen 1989 anni
85.133
+0.491
0.58%
1 gen 1990 anni
85.624
+0.491
0.58%
1 gen 1991 anni
86.114
+0.491
0.57%
1 gen 1992 anni
86.605
+0.491
0.57%
1 gen 1993 anni
87.095
+0.491
0.57%
1 gen 1994 anni
87.424
+0.329
0.38%
1 gen 1995 anni
87.754
+0.329
0.38%
1 gen 1996 anni
88.083
+0.329
0.38%
1 gen 1997 anni
88.412
+0.329
0.37%
1 gen 1998 anni
88.741
+0.329
0.37%
1 gen 1999 anni
89.215
+0.474
0.53%
1 gen 2000 anni
89.689
+0.474
0.53%
1 gen 2001 anni
90.163
+0.474
0.53%
1 gen 2002 anni
90.637
+0.474
0.53%
1 gen 2003 anni
91.112
+0.474
0.52%
1 gen 2004 anni
91.351
+0.239
0.26%
1 gen 2005 anni
91.59
+0.239
0.26%
1 gen 2006 anni
91.829
+0.239
0.26%
1 gen 2007 anni
92.068
+0.239
0.26%
1 gen 2008 anni
92.307
+0.239
0.26%
1 gen 2009 anni
92.494
+0.187
0.2%
1 gen 2010 anni
92.681
+0.187
0.2%
1 gen 2011 anni
92.868
+0.187
0.2%
1 gen 2012 anni
93.055
+0.187
0.2%
1 gen 2013 anni
93.242
+0.187
0.2%
1 gen 2014 anni
93.389
+0.147
0.16%
1 gen 2015 anni
93.536
+0.147
0.16%
Classificazione dei paesi secondo i statistiche attuali per anni


Commenti: