29
/it/
it
AIzaSyAYiBZKx7MnpbEhh9jyipgxe19OcubqV5w
April 1, 2024
191938
Malta
MLT
true
2
1
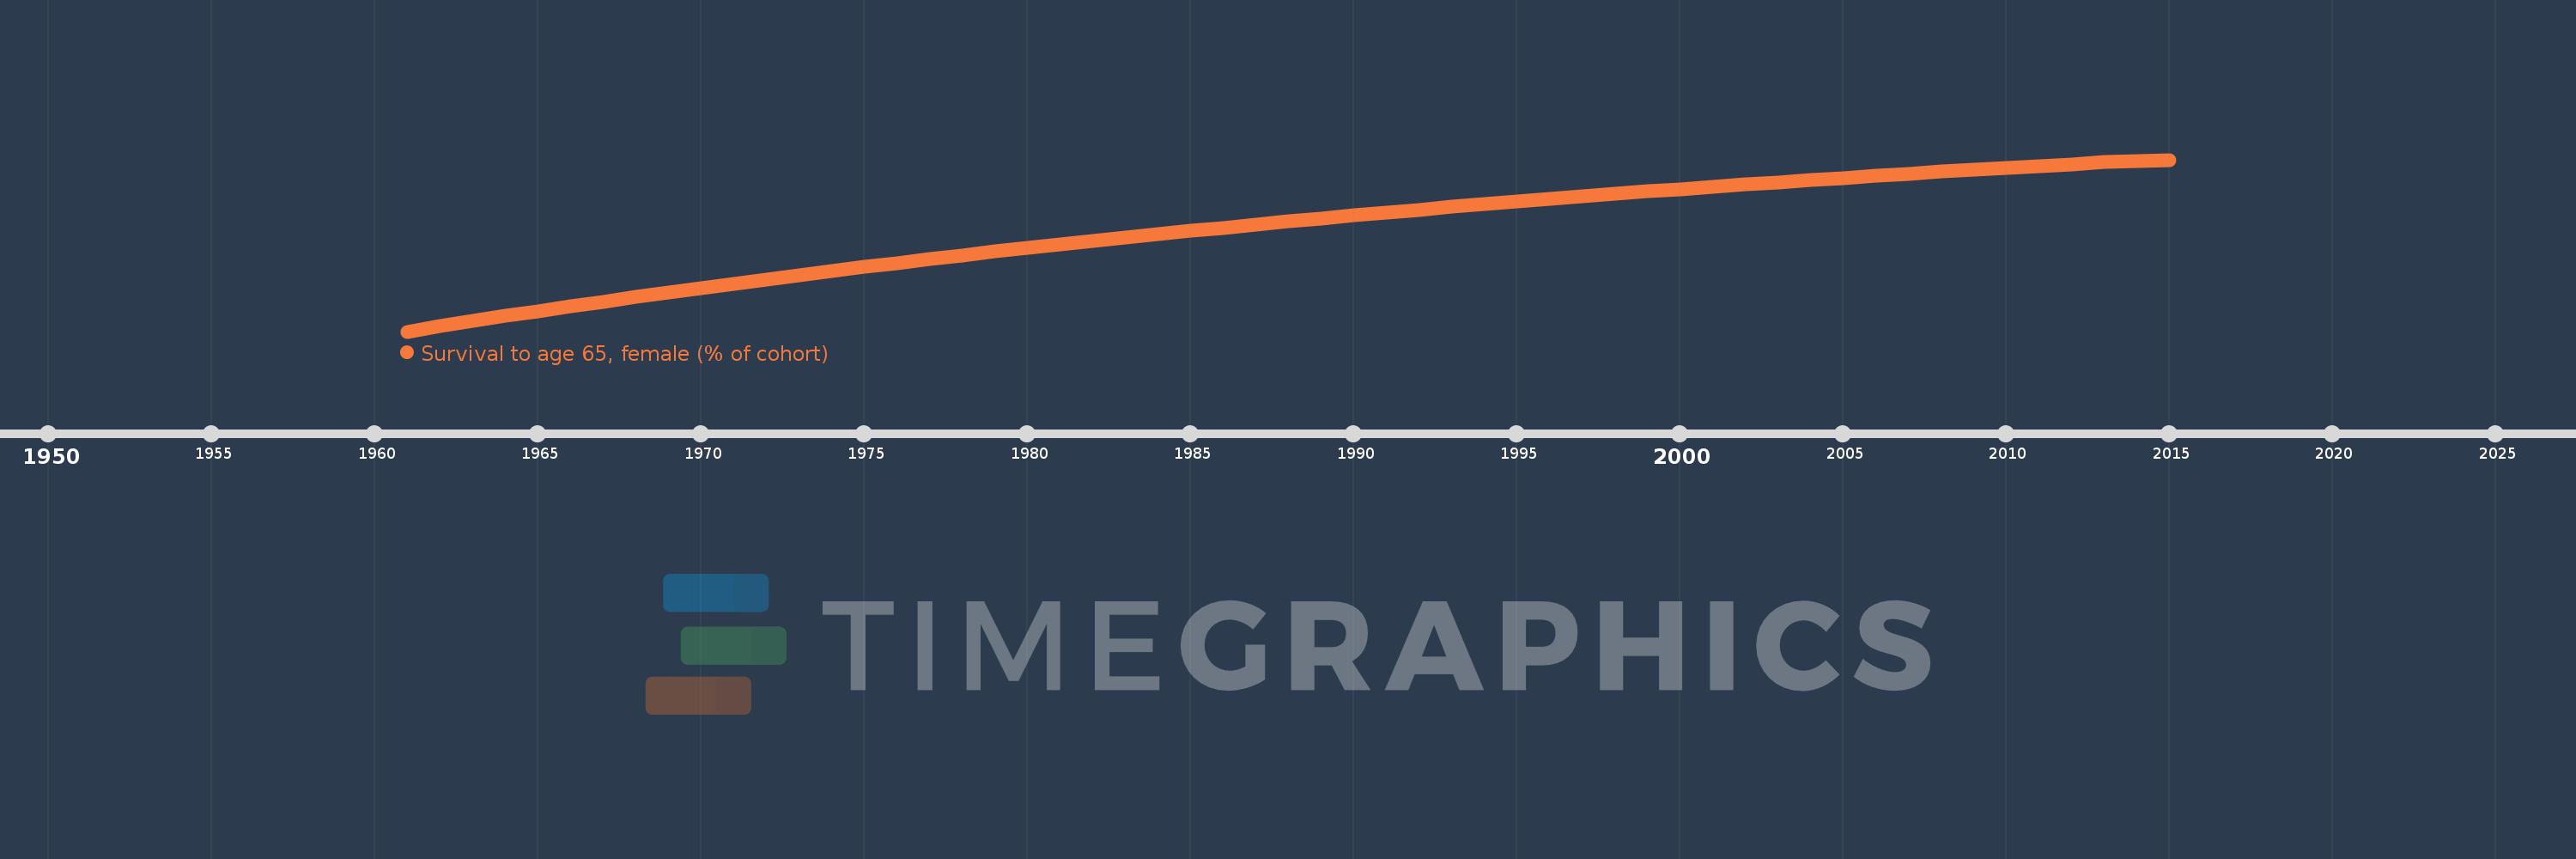
Survival to age 65, female (% of cohort)
2015,2014,2013,2012,2011,2010,2009,2008,2007,2006,2005,2004,2003,2002,2001,2000,1999,1998,1997,1996,1995,1994,1993,1992,1991,1990,1989,1988,1987,1986,1985,1984,1983,1982,1981,1980,1979,1978,1977,1976,1975,1974,1973,1972,1971,1970,1969,1968,1967,1966,1965,1964,1963,1962,1961
Queste statistiche in altri paesi:
AfghanistanAlbaniaAlgeriaAngolaAntigua and BarbudaArab WorldArgentinaArmeniaArubaAustraliaAustriaAzerbaijanBahamas, TheBahrainBangladeshBarbadosBelarusBelgiumBelizeBeninBhutanBoliviaBosnia and HerzegovinaBotswanaBrazilBrunei DarussalamBulgariaBurkina FasoBurundiCabo VerdeCambodiaCameroonCanadaCaribbean small statesCentral African RepublicCentral Europe and the BalticsChadChannel IslandsChileChinaColombiaComorosCongo, Dem. Rep.Congo, Rep.Costa RicaCote d'IvoireCroatiaCubaCuracaoCyprusCzech RepublicDenmarkDjiboutiDominican RepublicEarly-demographic dividendEast Asia & PacificEast Asia & Pacific (excluding high income)East Asia & Pacific (IDA & IBRD countries)EcuadorEgypt, Arab Rep.El SalvadorEquatorial GuineaEritreaEstoniaEthiopiaEuro areaEurope & Central AsiaEurope & Central Asia (excluding high income)Europe & Central Asia (IDA & IBRD countries)European UnionFijiFinlandFragile and conflict affected situationsFranceFrench PolynesiaGabonGambia, TheGeorgiaGermanyGhanaGreeceGrenadaGuamGuatemalaGuineaGuinea-BissauGuyanaHaitiHeavily indebted poor countries (HIPC)High incomeHondurasHong Kong SAR, ChinaHungaryIBRD onlyIcelandIDA & IBRD totalIDA blendIDA onlyIDA totalIndiaIndonesiaIran, Islamic Rep.IraqIrelandIsraelItalyJamaicaJapanJordanKazakhstanKenyaKiribatiKorea, Dem. People’s Rep.Korea, Rep.KuwaitKyrgyz RepublicLao PDRLate-demographic dividendLatin America & Caribbean Latin America & Caribbean (excluding high income)Latin America & the Caribbean (IDA & IBRD countries)LatviaLeast developed countries: UN classificationLebanonLesothoLiberiaLibyaLithuaniaLow & middle incomeLow incomeLower middle incomeLuxembourgMacao SAR, ChinaMacedonia, FYRMadagascarMalawiMalaysiaMaldivesMaliMaltaMauritaniaMauritiusMexicoMicronesia, Fed. Sts.Middle East & North AfricaMiddle East & North Africa (excluding high income)Middle East & North Africa (IDA & IBRD countries)Middle incomeMoldovaMongoliaMontenegroMoroccoMozambiqueMyanmarNamibiaNepalNetherlandsNew CaledoniaNew ZealandNicaraguaNigerNigeriaNorth AmericaNorwayOECD membersOmanOther small statesPacific island small statesPakistanPanamaPapua New GuineaParaguayPeruPhilippinesPolandPortugalPost-demographic dividendPre-demographic dividendPuerto RicoQatarRomaniaRussian FederationRwandaSamoaSao Tome and PrincipeSaudi ArabiaSenegalSerbiaSeychellesSierra LeoneSingaporeSlovak RepublicSloveniaSmall statesSolomon IslandsSomaliaSouth AfricaSouth AsiaSouth Asia (IDA & IBRD)South SudanSpainSri LankaSt. LuciaSt. Vincent and the GrenadinesSub-Saharan Africa Sub-Saharan Africa (excluding high income)Sub-Saharan Africa (IDA & IBRD countries)SudanSurinameSwazilandSwedenSwitzerlandSyrian Arab RepublicTajikistanTanzaniaThailandTimor-LesteTogoTongaTrinidad and TobagoTunisiaTurkeyTurkmenistanUgandaUkraineUnited Arab EmiratesUnited KingdomUnited StatesUpper middle incomeUruguayUzbekistanVanuatuVenezuela, RBVietnamVirgin Islands (U.S.)West Bank and GazaWorldYemen, Rep.ZambiaZimbabwe Linea del tempo:
Questa scala temporale mostra un grafico dal 1961 anno al 2015 anno. Malta. I dati fino ad 1960 anno non disponibili. Il numero di osservazioni attuali secondo i date: 55.
La fonte (nome):
Indicatori dello sviluppo mondiale
La fonte (organizzazione):
United Nations Population Division. World Population Prospects. New York, United Nations, Department of Economic and Social Affairs (advanced Excel tables). Available at http://esa.un.org/wpp/unpp/panel_population.htm.
Categorie:
Health, Gender
sono stati aggiornati
23 apr 2017 anni
Indicatori delle variazioni dei valori per anni
Minima:
76.059
1 gen 1961 anni
Massimo:
92.434
1 gen 2015 anni
Alla data di osservazione
Valore
Variazione assoluta
La variazione rispetto al valore precedente
1 gen 1961 anni
76.059
+76.059
0.0%
1 gen 1962 anni
76.566
+0.507
0.67%
1 gen 1963 anni
77.073
+0.507
0.66%
1 gen 1964 anni
77.533
+0.46
0.6%
1 gen 1965 anni
77.994
+0.46
0.59%
1 gen 1966 anni
78.454
+0.46
0.59%
1 gen 1967 anni
78.915
+0.46
0.59%
1 gen 1968 anni
79.375
+0.46
0.58%
1 gen 1969 anni
79.792
+0.417
0.53%
1 gen 1970 anni
80.209
+0.417
0.52%
1 gen 1971 anni
80.626
+0.417
0.52%
1 gen 1972 anni
81.043
+0.417
0.52%
1 gen 1973 anni
81.46
+0.417
0.51%
1 gen 1974 anni
81.837
+0.377
0.46%
1 gen 1975 anni
82.214
+0.377
0.46%
1 gen 1976 anni
82.59
+0.377
0.46%
1 gen 1977 anni
82.967
+0.377
0.46%
1 gen 1978 anni
83.344
+0.377
0.45%
1 gen 1979 anni
83.684
+0.34
0.41%
1 gen 1980 anni
84.024
+0.34
0.41%
1 gen 1981 anni
84.364
+0.34
0.4%
1 gen 1982 anni
84.704
+0.34
0.4%
1 gen 1983 anni
85.044
+0.34
0.4%
1 gen 1984 anni
85.35
+0.306
0.36%
1 gen 1985 anni
85.656
+0.306
0.36%
1 gen 1986 anni
85.962
+0.306
0.36%
1 gen 1987 anni
86.268
+0.306
0.36%
1 gen 1988 anni
86.574
+0.306
0.35%
1 gen 1989 anni
86.85
+0.275
0.32%
1 gen 1990 anni
87.125
+0.275
0.32%
1 gen 1991 anni
87.401
+0.275
0.32%
1 gen 1992 anni
87.676
+0.275
0.32%
1 gen 1993 anni
87.951
+0.275
0.31%
1 gen 1994 anni
88.199
+0.248
0.28%
1 gen 1995 anni
88.446
+0.248
0.28%
1 gen 1996 anni
88.694
+0.248
0.28%
1 gen 1997 anni
88.942
+0.248
0.28%
1 gen 1998 anni
89.189
+0.248
0.28%
1 gen 1999 anni
89.411
+0.222
0.25%
1 gen 2000 anni
89.634
+0.222
0.25%
1 gen 2001 anni
89.856
+0.222
0.25%
1 gen 2002 anni
90.078
+0.222
0.25%
1 gen 2003 anni
90.3
+0.222
0.25%
1 gen 2004 anni
90.5
+0.199
0.22%
1 gen 2005 anni
90.699
+0.199
0.22%
1 gen 2006 anni
90.899
+0.199
0.22%
1 gen 2007 anni
91.098
+0.199
0.22%
1 gen 2008 anni
91.297
+0.199
0.22%
1 gen 2009 anni
91.476
+0.179
0.2%
1 gen 2010 anni
91.655
+0.179
0.2%
1 gen 2011 anni
91.834
+0.179
0.2%
1 gen 2012 anni
92.013
+0.179
0.19%
1 gen 2013 anni
92.192
+0.179
0.19%
1 gen 2014 anni
92.313
+0.121
0.13%
1 gen 2015 anni
92.434
+0.121
0.13%
Classificazione dei paesi secondo i statistiche attuali per anni


Commenti: