29
/it/
it
AIzaSyAYiBZKx7MnpbEhh9jyipgxe19OcubqV5w
April 1, 2024
158982
Iraq
IRQ
true
2
1
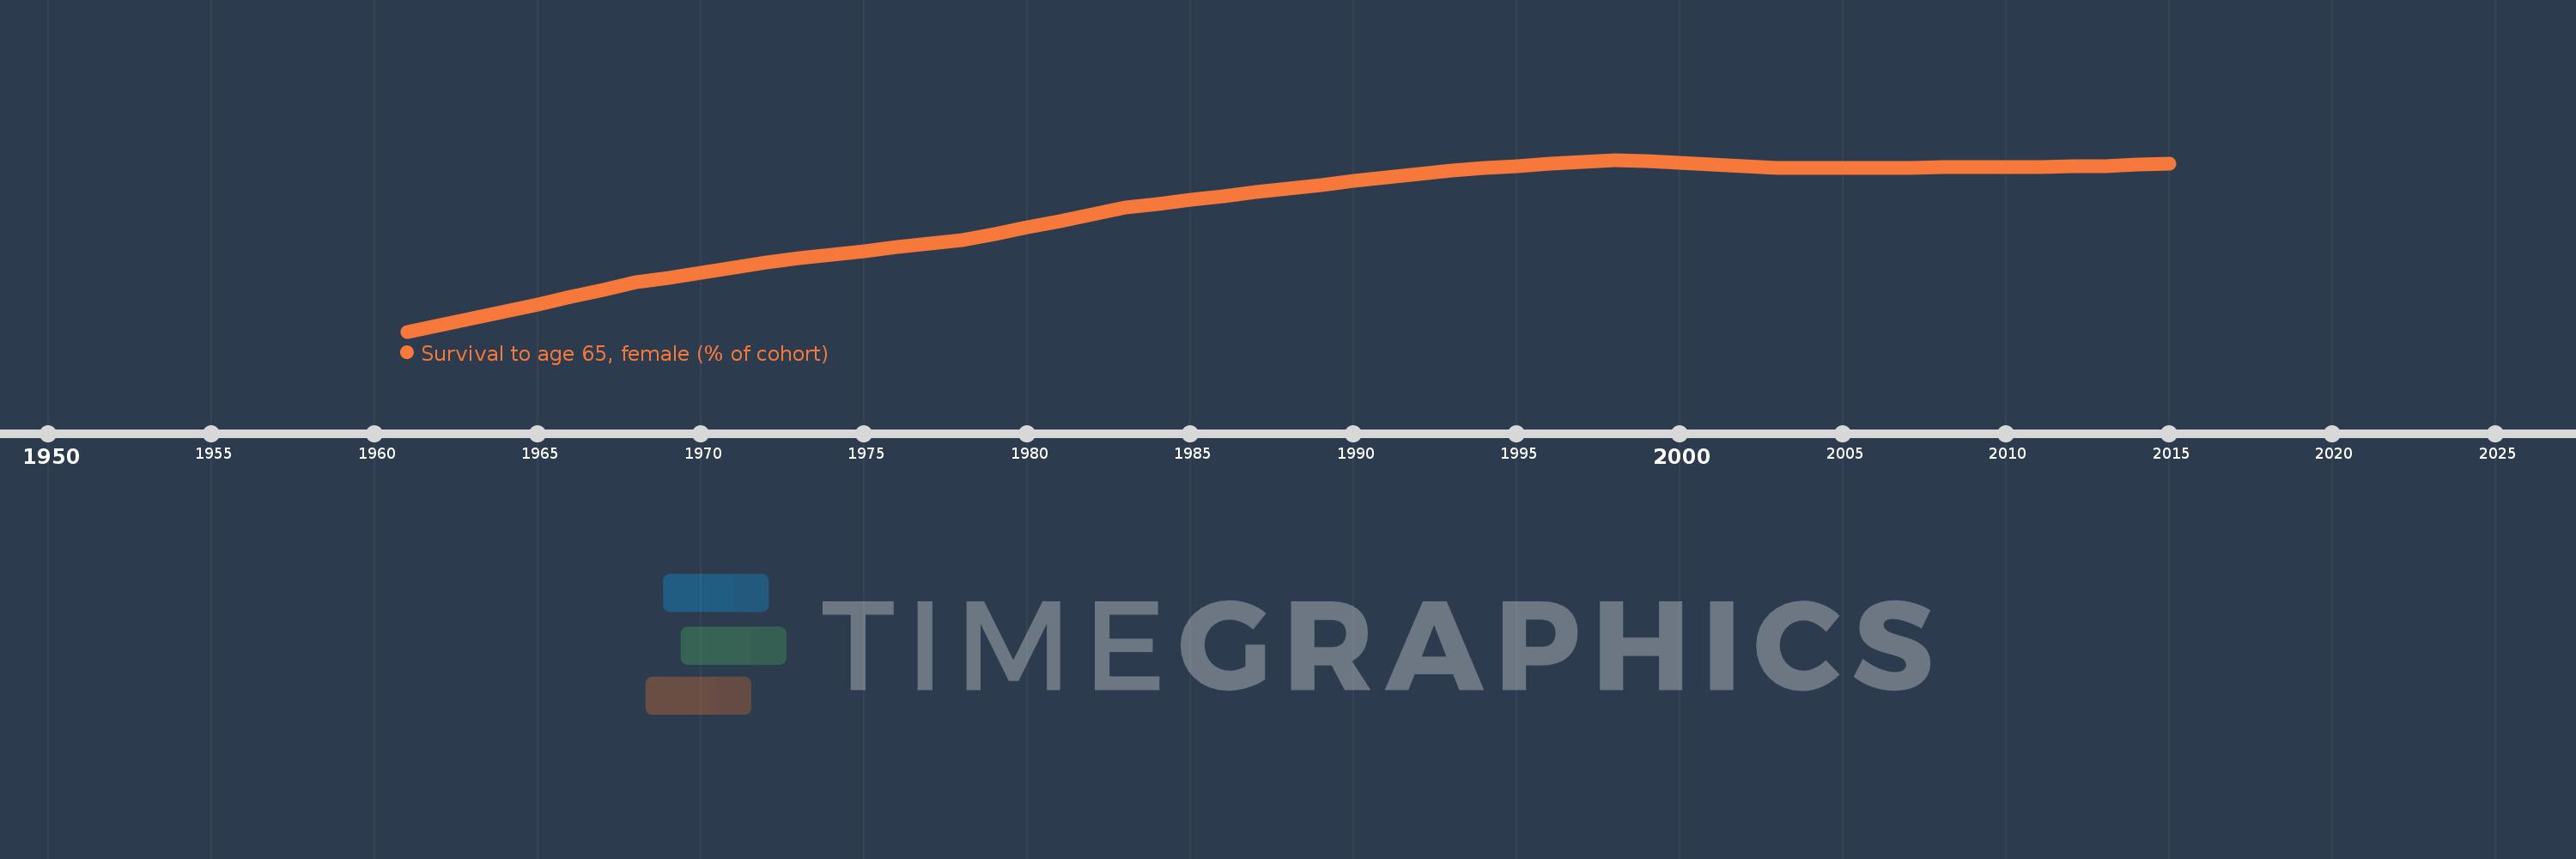
Survival to age 65, female (% of cohort)
2015,2014,2013,2012,2011,2010,2009,2008,2007,2006,2005,2004,2003,2002,2001,2000,1999,1998,1997,1996,1995,1994,1993,1992,1991,1990,1989,1988,1987,1986,1985,1984,1983,1982,1981,1980,1979,1978,1977,1976,1975,1974,1973,1972,1971,1970,1969,1968,1967,1966,1965,1964,1963,1962,1961
Queste statistiche in altri paesi:
AfghanistanAlbaniaAlgeriaAngolaAntigua and BarbudaArab WorldArgentinaArmeniaArubaAustraliaAustriaAzerbaijanBahamas, TheBahrainBangladeshBarbadosBelarusBelgiumBelizeBeninBhutanBoliviaBosnia and HerzegovinaBotswanaBrazilBrunei DarussalamBulgariaBurkina FasoBurundiCabo VerdeCambodiaCameroonCanadaCaribbean small statesCentral African RepublicCentral Europe and the BalticsChadChannel IslandsChileChinaColombiaComorosCongo, Dem. Rep.Congo, Rep.Costa RicaCote d'IvoireCroatiaCubaCuracaoCyprusCzech RepublicDenmarkDjiboutiDominican RepublicEarly-demographic dividendEast Asia & PacificEast Asia & Pacific (excluding high income)East Asia & Pacific (IDA & IBRD countries)EcuadorEgypt, Arab Rep.El SalvadorEquatorial GuineaEritreaEstoniaEthiopiaEuro areaEurope & Central AsiaEurope & Central Asia (excluding high income)Europe & Central Asia (IDA & IBRD countries)European UnionFijiFinlandFragile and conflict affected situationsFranceFrench PolynesiaGabonGambia, TheGeorgiaGermanyGhanaGreeceGrenadaGuamGuatemalaGuineaGuinea-BissauGuyanaHaitiHeavily indebted poor countries (HIPC)High incomeHondurasHong Kong SAR, ChinaHungaryIBRD onlyIcelandIDA & IBRD totalIDA blendIDA onlyIDA totalIndiaIndonesiaIran, Islamic Rep.IraqIrelandIsraelItalyJamaicaJapanJordanKazakhstanKenyaKiribatiKorea, Dem. People’s Rep.Korea, Rep.KuwaitKyrgyz RepublicLao PDRLate-demographic dividendLatin America & Caribbean Latin America & Caribbean (excluding high income)Latin America & the Caribbean (IDA & IBRD countries)LatviaLeast developed countries: UN classificationLebanonLesothoLiberiaLibyaLithuaniaLow & middle incomeLow incomeLower middle incomeLuxembourgMacao SAR, ChinaMacedonia, FYRMadagascarMalawiMalaysiaMaldivesMaliMaltaMauritaniaMauritiusMexicoMicronesia, Fed. Sts.Middle East & North AfricaMiddle East & North Africa (excluding high income)Middle East & North Africa (IDA & IBRD countries)Middle incomeMoldovaMongoliaMontenegroMoroccoMozambiqueMyanmarNamibiaNepalNetherlandsNew CaledoniaNew ZealandNicaraguaNigerNigeriaNorth AmericaNorwayOECD membersOmanOther small statesPacific island small statesPakistanPanamaPapua New GuineaParaguayPeruPhilippinesPolandPortugalPost-demographic dividendPre-demographic dividendPuerto RicoQatarRomaniaRussian FederationRwandaSamoaSao Tome and PrincipeSaudi ArabiaSenegalSerbiaSeychellesSierra LeoneSingaporeSlovak RepublicSloveniaSmall statesSolomon IslandsSomaliaSouth AfricaSouth AsiaSouth Asia (IDA & IBRD)South SudanSpainSri LankaSt. LuciaSt. Vincent and the GrenadinesSub-Saharan Africa Sub-Saharan Africa (excluding high income)Sub-Saharan Africa (IDA & IBRD countries)SudanSurinameSwazilandSwedenSwitzerlandSyrian Arab RepublicTajikistanTanzaniaThailandTimor-LesteTogoTongaTrinidad and TobagoTunisiaTurkeyTurkmenistanUgandaUkraineUnited Arab EmiratesUnited KingdomUnited StatesUpper middle incomeUruguayUzbekistanVanuatuVenezuela, RBVietnamVirgin Islands (U.S.)West Bank and GazaWorldYemen, Rep.ZambiaZimbabwe Linea del tempo:
Questa scala temporale mostra un grafico dal 1961 anno al 2015 anno. Iraq. I dati fino ad 1960 anno non disponibili. Il numero di osservazioni attuali secondo i date: 55.
La fonte (nome):
Indicatori dello sviluppo mondiale
La fonte (organizzazione):
United Nations Population Division. World Population Prospects. New York, United Nations, Department of Economic and Social Affairs (advanced Excel tables). Available at http://esa.un.org/wpp/unpp/panel_population.htm.
Categorie:
Health, Gender
sono stati aggiornati
23 apr 2017 anni
Indicatori delle variazioni dei valori per anni
Minima:
40.66
1 gen 1961 anni
Massimo:
78.519
1 gen 1998 anni
Alla data di osservazione
Valore
Variazione assoluta
La variazione rispetto al valore precedente
1 gen 1961 anni
40.66
+40.66
0.0%
1 gen 1962 anni
42.087
+1.427
3.51%
1 gen 1963 anni
43.514
+1.427
3.39%
1 gen 1964 anni
45.103
+1.589
3.65%
1 gen 1965 anni
46.691
+1.589
3.52%
1 gen 1966 anni
48.28
+1.589
3.4%
1 gen 1967 anni
49.869
+1.589
3.29%
1 gen 1968 anni
51.457
+1.589
3.19%
1 gen 1969 anni
52.55
+1.092
2.12%
1 gen 1970 anni
53.642
+1.092
2.08%
1 gen 1971 anni
54.735
+1.092
2.04%
1 gen 1972 anni
55.827
+1.092
2.0%
1 gen 1973 anni
56.92
+1.092
1.96%
1 gen 1974 anni
57.683
+0.764
1.34%
1 gen 1975 anni
58.447
+0.764
1.32%
1 gen 1976 anni
59.211
+0.764
1.31%
1 gen 1977 anni
59.975
+0.764
1.29%
1 gen 1978 anni
60.739
+0.764
1.27%
1 gen 1979 anni
62.176
+1.437
2.37%
1 gen 1980 anni
63.613
+1.437
2.31%
1 gen 1981 anni
65.05
+1.437
2.26%
1 gen 1982 anni
66.487
+1.437
2.21%
1 gen 1983 anni
67.924
+1.437
2.16%
1 gen 1984 anni
68.776
+0.853
1.26%
1 gen 1985 anni
69.629
+0.853
1.24%
1 gen 1986 anni
70.481
+0.853
1.22%
1 gen 1987 anni
71.334
+0.853
1.21%
1 gen 1988 anni
72.187
+0.853
1.2%
1 gen 1989 anni
72.997
+0.81
1.12%
1 gen 1990 anni
73.807
+0.81
1.11%
1 gen 1991 anni
74.617
+0.81
1.1%
1 gen 1992 anni
75.427
+0.81
1.09%
1 gen 1993 anni
76.237
+0.81
1.07%
1 gen 1994 anni
76.693
+0.457
0.6%
1 gen 1995 anni
77.15
+0.457
0.6%
1 gen 1996 anni
77.606
+0.457
0.59%
1 gen 1997 anni
78.063
+0.457
0.59%
1 gen 1998 anni
78.519
+0.457
0.58%
1 gen 1999 anni
78.145
-0.375
-0.48%
1 gen 2000 anni
77.77
-0.375
-0.48%
1 gen 2001 anni
77.395
-0.375
-0.48%
1 gen 2002 anni
77.021
-0.375
-0.48%
1 gen 2003 anni
76.646
-0.375
-0.49%
1 gen 2004 anni
76.684
+0.038
0.05%
1 gen 2005 anni
76.722
+0.038
0.05%
1 gen 2006 anni
76.759
+0.038
0.05%
1 gen 2007 anni
76.797
+0.038
0.05%
1 gen 2008 anni
76.835
+0.038
0.05%
1 gen 2009 anni
76.89
+0.055
0.07%
1 gen 2010 anni
76.944
+0.055
0.07%
1 gen 2011 anni
76.999
+0.055
0.07%
1 gen 2012 anni
77.054
+0.055
0.07%
1 gen 2013 anni
77.109
+0.055
0.07%
1 gen 2014 anni
77.402
+0.293
0.38%
1 gen 2015 anni
77.695
+0.293
0.38%
Classificazione dei paesi secondo i statistiche attuali per anni


Commenti: