29
/it/
it
AIzaSyAYiBZKx7MnpbEhh9jyipgxe19OcubqV5w
April 1, 2024
259008
Syrian Arab Republic
SYR
true
2
1
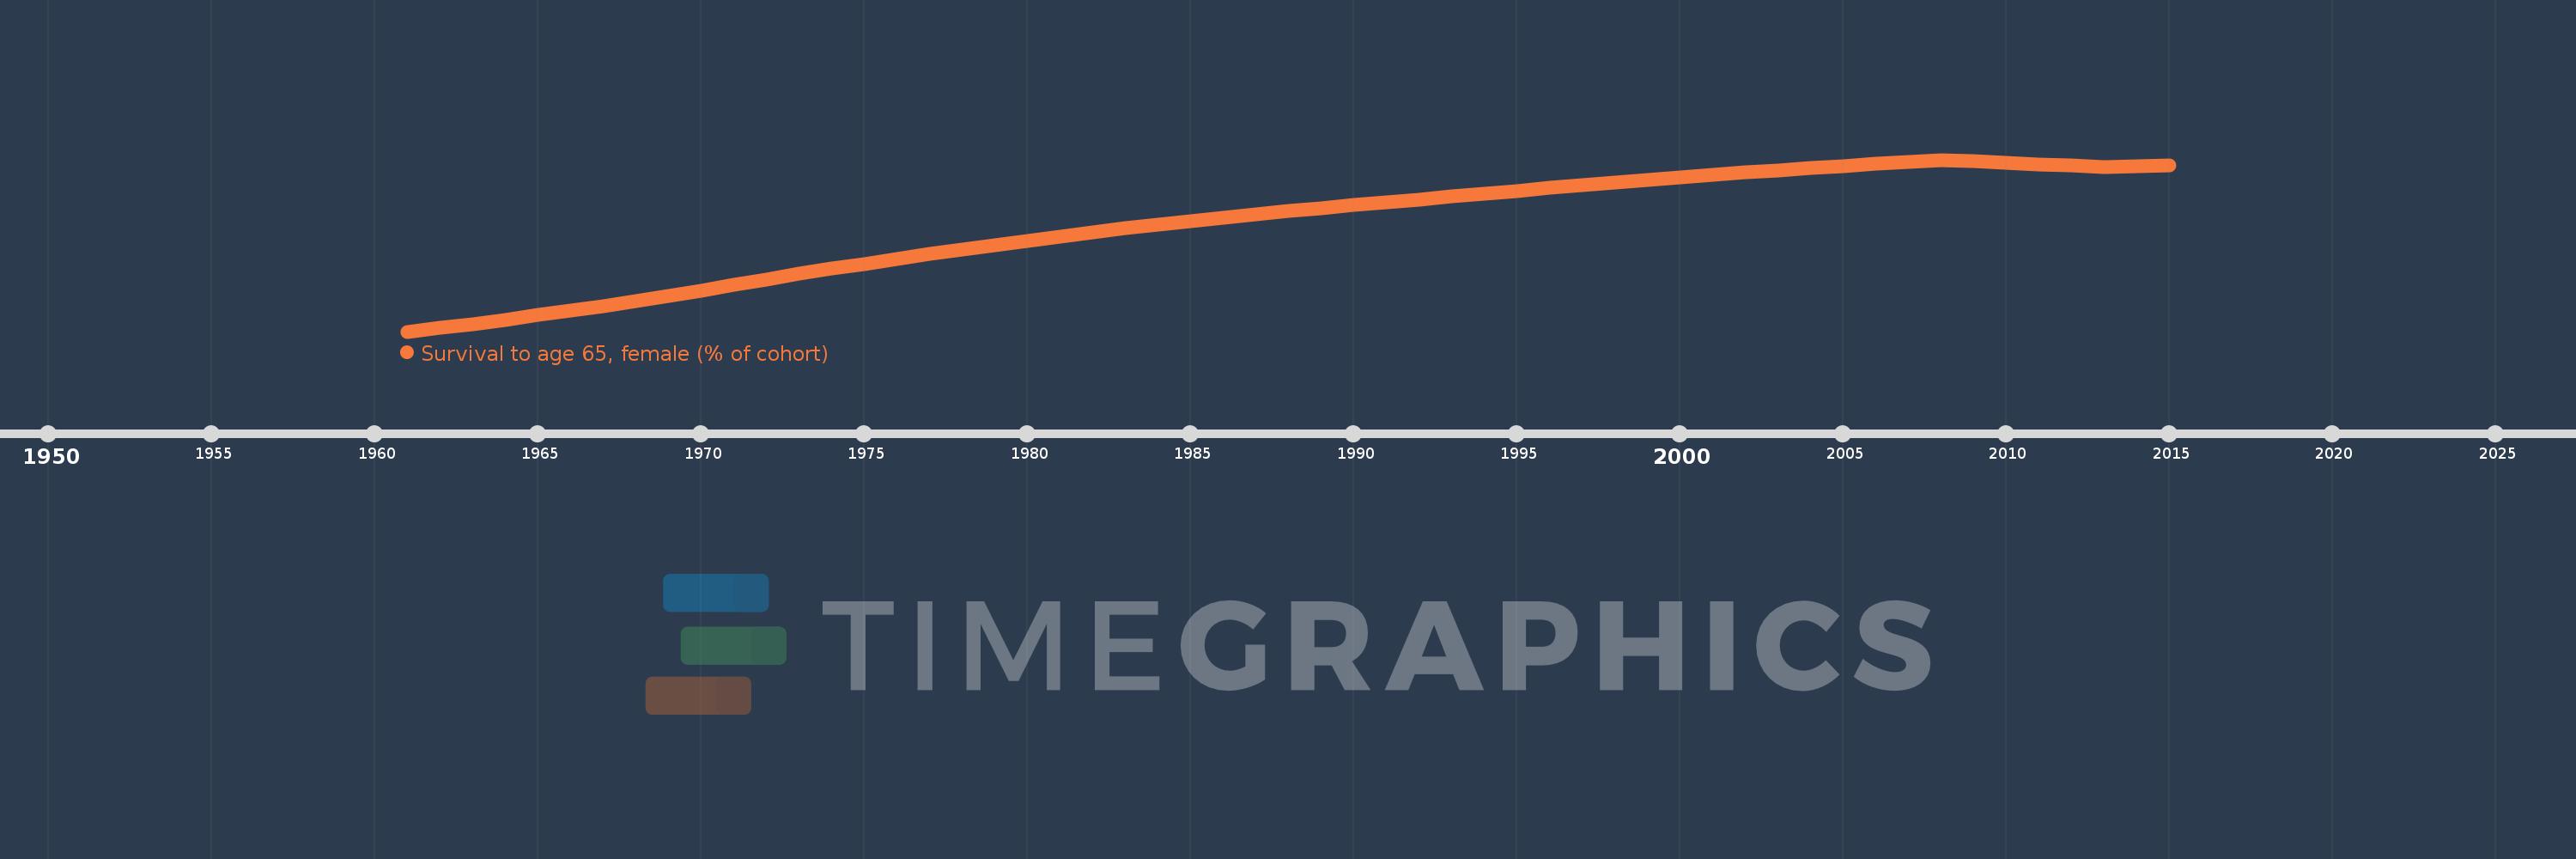
Survival to age 65, female (% of cohort)
2015,2014,2013,2012,2011,2010,2009,2008,2007,2006,2005,2004,2003,2002,2001,2000,1999,1998,1997,1996,1995,1994,1993,1992,1991,1990,1989,1988,1987,1986,1985,1984,1983,1982,1981,1980,1979,1978,1977,1976,1975,1974,1973,1972,1971,1970,1969,1968,1967,1966,1965,1964,1963,1962,1961
Queste statistiche in altri paesi:
AfghanistanAlbaniaAlgeriaAngolaAntigua and BarbudaArab WorldArgentinaArmeniaArubaAustraliaAustriaAzerbaijanBahamas, TheBahrainBangladeshBarbadosBelarusBelgiumBelizeBeninBhutanBoliviaBosnia and HerzegovinaBotswanaBrazilBrunei DarussalamBulgariaBurkina FasoBurundiCabo VerdeCambodiaCameroonCanadaCaribbean small statesCentral African RepublicCentral Europe and the BalticsChadChannel IslandsChileChinaColombiaComorosCongo, Dem. Rep.Congo, Rep.Costa RicaCote d'IvoireCroatiaCubaCuracaoCyprusCzech RepublicDenmarkDjiboutiDominican RepublicEarly-demographic dividendEast Asia & PacificEast Asia & Pacific (excluding high income)East Asia & Pacific (IDA & IBRD countries)EcuadorEgypt, Arab Rep.El SalvadorEquatorial GuineaEritreaEstoniaEthiopiaEuro areaEurope & Central AsiaEurope & Central Asia (excluding high income)Europe & Central Asia (IDA & IBRD countries)European UnionFijiFinlandFragile and conflict affected situationsFranceFrench PolynesiaGabonGambia, TheGeorgiaGermanyGhanaGreeceGrenadaGuamGuatemalaGuineaGuinea-BissauGuyanaHaitiHeavily indebted poor countries (HIPC)High incomeHondurasHong Kong SAR, ChinaHungaryIBRD onlyIcelandIDA & IBRD totalIDA blendIDA onlyIDA totalIndiaIndonesiaIran, Islamic Rep.IraqIrelandIsraelItalyJamaicaJapanJordanKazakhstanKenyaKiribatiKorea, Dem. People’s Rep.Korea, Rep.KuwaitKyrgyz RepublicLao PDRLate-demographic dividendLatin America & Caribbean Latin America & Caribbean (excluding high income)Latin America & the Caribbean (IDA & IBRD countries)LatviaLeast developed countries: UN classificationLebanonLesothoLiberiaLibyaLithuaniaLow & middle incomeLow incomeLower middle incomeLuxembourgMacao SAR, ChinaMacedonia, FYRMadagascarMalawiMalaysiaMaldivesMaliMaltaMauritaniaMauritiusMexicoMicronesia, Fed. Sts.Middle East & North AfricaMiddle East & North Africa (excluding high income)Middle East & North Africa (IDA & IBRD countries)Middle incomeMoldovaMongoliaMontenegroMoroccoMozambiqueMyanmarNamibiaNepalNetherlandsNew CaledoniaNew ZealandNicaraguaNigerNigeriaNorth AmericaNorwayOECD membersOmanOther small statesPacific island small statesPakistanPanamaPapua New GuineaParaguayPeruPhilippinesPolandPortugalPost-demographic dividendPre-demographic dividendPuerto RicoQatarRomaniaRussian FederationRwandaSamoaSao Tome and PrincipeSaudi ArabiaSenegalSerbiaSeychellesSierra LeoneSingaporeSlovak RepublicSloveniaSmall statesSolomon IslandsSomaliaSouth AfricaSouth AsiaSouth Asia (IDA & IBRD)South SudanSpainSri LankaSt. LuciaSt. Vincent and the GrenadinesSub-Saharan Africa Sub-Saharan Africa (excluding high income)Sub-Saharan Africa (IDA & IBRD countries)SudanSurinameSwazilandSwedenSwitzerlandSyrian Arab RepublicTajikistanTanzaniaThailandTimor-LesteTogoTongaTrinidad and TobagoTunisiaTurkeyTurkmenistanUgandaUkraineUnited Arab EmiratesUnited KingdomUnited StatesUpper middle incomeUruguayUzbekistanVanuatuVenezuela, RBVietnamVirgin Islands (U.S.)West Bank and GazaWorldYemen, Rep.ZambiaZimbabwe Linea del tempo:
Questa scala temporale mostra un grafico dal 1961 anno al 2015 anno. Syrian Arab Republic. I dati fino ad 1960 anno non disponibili. Il numero di osservazioni attuali secondo i date: 55.
La fonte (nome):
Indicatori dello sviluppo mondiale
La fonte (organizzazione):
United Nations Population Division. World Population Prospects. New York, United Nations, Department of Economic and Social Affairs (advanced Excel tables). Available at http://esa.un.org/wpp/unpp/panel_population.htm.
Categorie:
Health, Gender
sono stati aggiornati
23 apr 2017 anni
Indicatori delle variazioni dei valori per anni
Minima:
48.197
1 gen 1961 anni
Massimo:
86.5
1 gen 2008 anni
Alla data di osservazione
Valore
Variazione assoluta
La variazione rispetto al valore precedente
1 gen 1961 anni
48.197
+48.197
0.0%
1 gen 1962 anni
49.022
+0.824
1.71%
1 gen 1963 anni
49.846
+0.824
1.68%
1 gen 1964 anni
50.858
+1.012
2.03%
1 gen 1965 anni
51.87
+1.012
1.99%
1 gen 1966 anni
52.881
+1.012
1.95%
1 gen 1967 anni
53.893
+1.012
1.91%
1 gen 1968 anni
54.905
+1.012
1.88%
1 gen 1969 anni
56.141
+1.236
2.25%
1 gen 1970 anni
57.377
+1.236
2.2%
1 gen 1971 anni
58.613
+1.236
2.15%
1 gen 1972 anni
59.849
+1.236
2.11%
1 gen 1973 anni
61.085
+1.236
2.07%
1 gen 1974 anni
62.184
+1.099
1.8%
1 gen 1975 anni
63.282
+1.099
1.77%
1 gen 1976 anni
64.381
+1.099
1.74%
1 gen 1977 anni
65.479
+1.099
1.71%
1 gen 1978 anni
66.578
+1.099
1.68%
1 gen 1979 anni
67.515
+0.937
1.41%
1 gen 1980 anni
68.451
+0.937
1.39%
1 gen 1981 anni
69.388
+0.937
1.37%
1 gen 1982 anni
70.325
+0.937
1.35%
1 gen 1983 anni
71.262
+0.937
1.33%
1 gen 1984 anni
72.029
+0.768
1.08%
1 gen 1985 anni
72.797
+0.767
1.07%
1 gen 1986 anni
73.564
+0.767
1.05%
1 gen 1987 anni
74.332
+0.767
1.04%
1 gen 1988 anni
75.099
+0.767
1.03%
1 gen 1989 anni
75.735
+0.636
0.85%
1 gen 1990 anni
76.37
+0.636
0.84%
1 gen 1991 anni
77.006
+0.636
0.83%
1 gen 1992 anni
77.642
+0.636
0.83%
1 gen 1993 anni
78.277
+0.636
0.82%
1 gen 1994 anni
78.916
+0.639
0.82%
1 gen 1995 anni
79.556
+0.639
0.81%
1 gen 1996 anni
80.195
+0.639
0.8%
1 gen 1997 anni
80.835
+0.639
0.8%
1 gen 1998 anni
81.474
+0.639
0.79%
1 gen 1999 anni
82.014
+0.54
0.66%
1 gen 2000 anni
82.554
+0.54
0.66%
1 gen 2001 anni
83.094
+0.54
0.65%
1 gen 2002 anni
83.634
+0.54
0.65%
1 gen 2003 anni
84.174
+0.54
0.65%
1 gen 2004 anni
84.639
+0.465
0.55%
1 gen 2005 anni
85.104
+0.465
0.55%
1 gen 2006 anni
85.569
+0.465
0.55%
1 gen 2007 anni
86.034
+0.465
0.54%
1 gen 2008 anni
86.5
+0.465
0.54%
1 gen 2009 anni
86.167
-0.333
-0.38%
1 gen 2010 anni
85.834
-0.333
-0.39%
1 gen 2011 anni
85.501
-0.333
-0.39%
1 gen 2012 anni
85.168
-0.333
-0.39%
1 gen 2013 anni
84.836
-0.333
-0.39%
1 gen 2014 anni
85.07
+0.234
0.28%
1 gen 2015 anni
85.304
+0.234
0.28%
Classificazione dei paesi secondo i statistiche attuali per anni


Commenti: