29
/it/
it
AIzaSyAYiBZKx7MnpbEhh9jyipgxe19OcubqV5w
April 1, 2024
284137
West Bank and Gaza
PSE
true
2
1
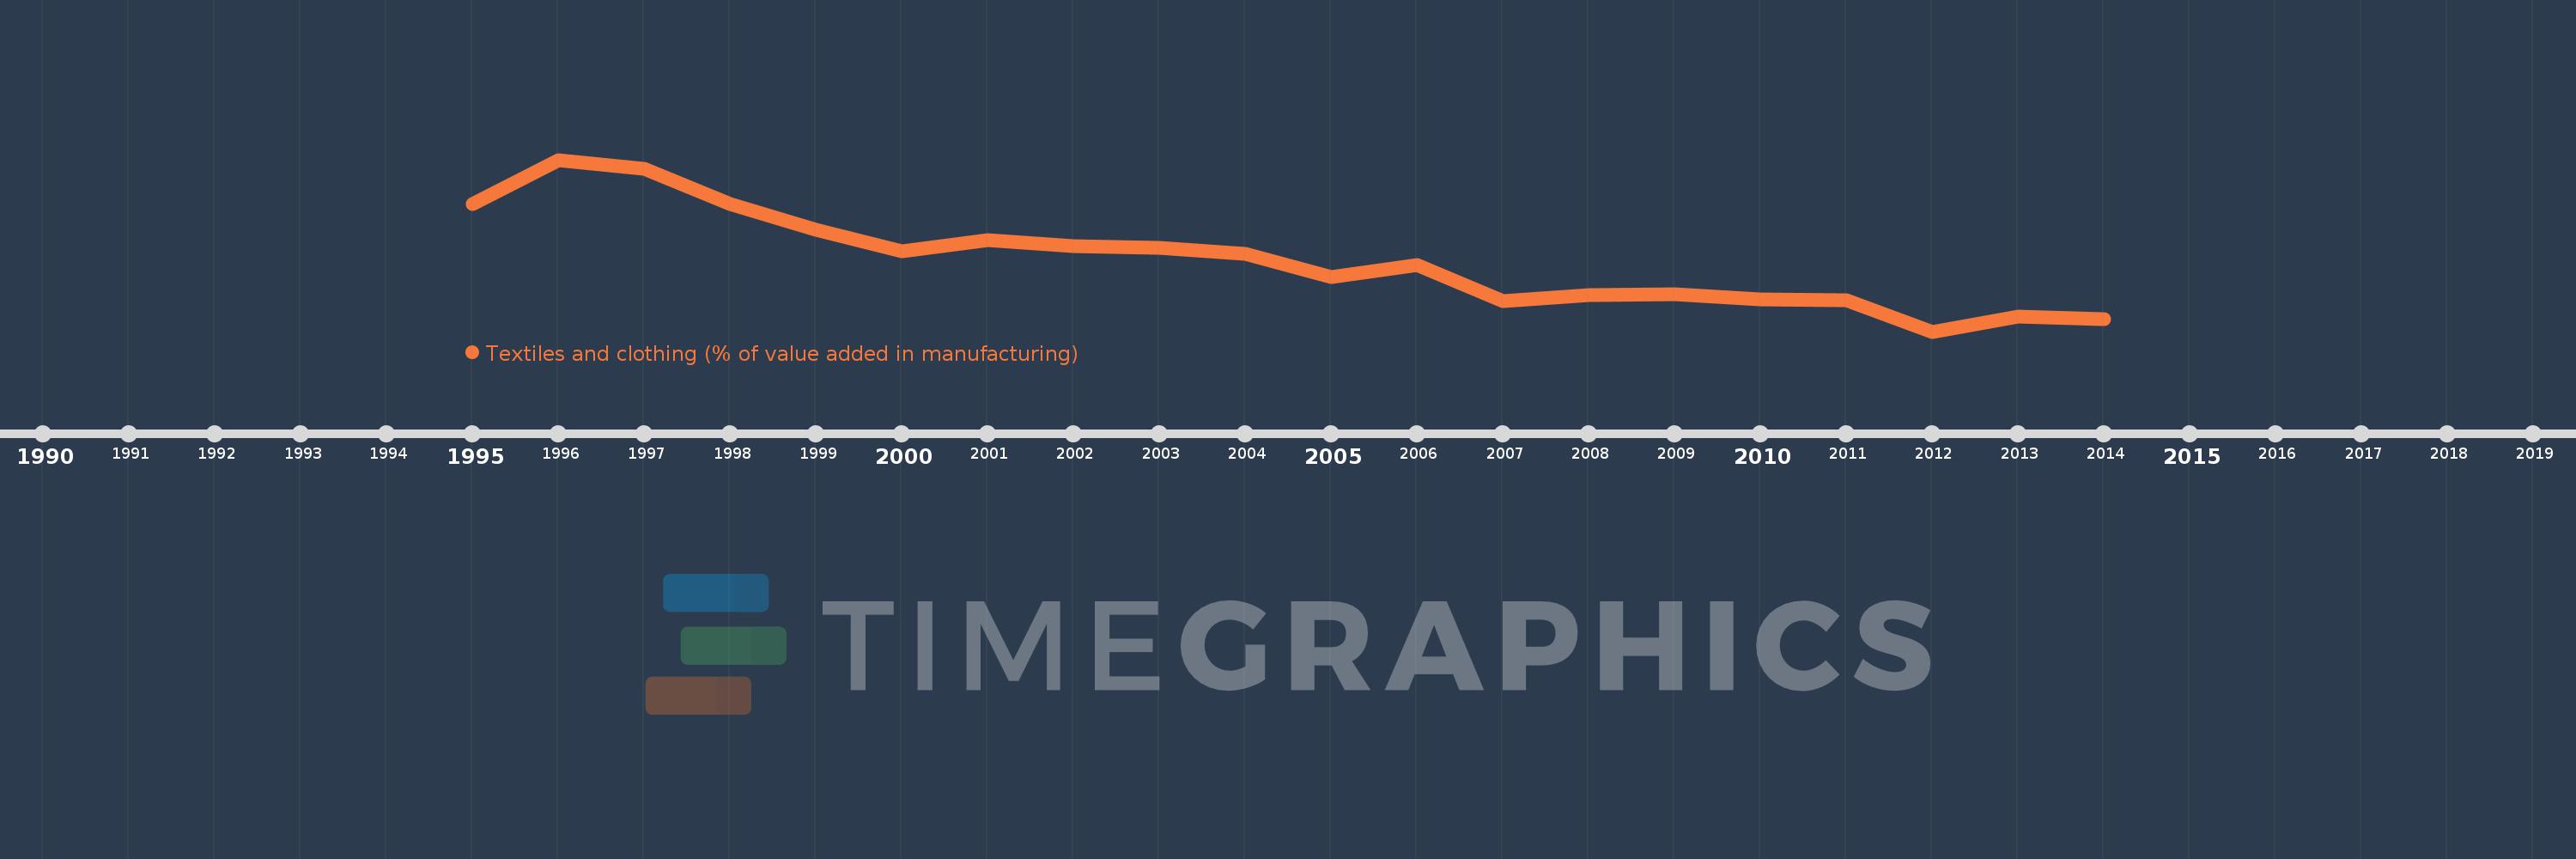
Textiles and clothing (% of value added in manufacturing)
2014,2013,2012,2011,2010,2009,2008,2007,2006,2005,2004,2003,2002,2001,2000,1999,1998,1997,1996,1995
Queste statistiche in altri paesi:
AlbaniaAlgeriaArgentinaAustraliaAustriaAzerbaijanBahamas, TheBahrainBangladeshBarbadosBelarusBelgiumBelizeBeninBoliviaBosnia and HerzegovinaBotswanaBrazilBulgariaBurkina FasoBurundiCambodiaCameroonCanadaCentral African RepublicChileChinaColombiaCongo, Rep.Costa RicaCote d'IvoireCroatiaCubaCyprusCzech RepublicDenmarkDominican RepublicEcuadorEgypt, Arab Rep.El SalvadorEritreaEstoniaEthiopiaFijiFinlandFranceGabonGambia, TheGeorgiaGermanyGhanaGreeceGuatemalaHondurasHong Kong SAR, ChinaHungaryIcelandIndiaIndonesiaIran, Islamic Rep.IraqIrelandIsraelItalyJamaicaJapanJordanKazakhstanKenyaKorea, Rep.KuwaitKyrgyz RepublicLao PDRLatviaLebanonLesothoLibyaLithuaniaLuxembourgMacao SAR, ChinaMacedonia, FYRMadagascarMalawiMalaysiaMaltaMauritiusMexicoMoldovaMongoliaMoroccoMozambiqueNamibiaNepalNetherlandsNew ZealandNicaraguaNigerNigeriaNorwayOmanPakistanPanamaPapua New GuineaParaguayPeruPhilippinesPolandPortugalPuerto RicoQatarRomaniaRussian FederationRwandaSaudi ArabiaSenegalSerbiaSierra LeoneSingaporeSlovak RepublicSloveniaSomaliaSouth AfricaSpainSri LankaSt. LuciaSudanSwazilandSwedenSwitzerlandSyrian Arab RepublicTanzaniaThailandTongaTrinidad and TobagoTunisiaTurkeyUgandaUkraineUnited Arab EmiratesUnited KingdomUnited StatesUruguayVenezuela, RBVietnamWest Bank and GazaYemen, Rep.Zambia Linea del tempo:
Questa scala temporale mostra un grafico dal 1995 anno al 2014 anno. West Bank and Gaza. I dati fino ad 1994 anno non disponibili. Il numero di osservazioni attuali secondo i date: 20.
La fonte (nome):
Indicatori dello sviluppo mondiale
La fonte (organizzazione):
United Nations Industrial Development Organization, International Yearbook of Industrial Statistics.
Categorie:
Economy & Growth
sono stati aggiornati
23 apr 2017 anni
Indicatori delle variazioni dei valori per anni
Minima:
7.239
1 gen 2012 anni
Massimo:
33.153
1 gen 1996 anni
Alla data di osservazione
Valore
Variazione assoluta
La variazione rispetto al valore precedente
1 gen 1995 anni
26.538
+26.538
0.0%
1 gen 1996 anni
33.153
+6.615
24.93%
1 gen 1997 anni
31.782
-1.371
-4.13%
1 gen 1998 anni
26.524
-5.258
-16.55%
1 gen 1999 anni
22.572
-3.951
-14.9%
1 gen 2000 anni
19.324
-3.248
-14.39%
1 gen 2001 anni
20.976
+1.651
8.55%
1 gen 2002 anni
20.07
-0.905
-4.32%
1 gen 2003 anni
19.829
-0.241
-1.2%
1 gen 2004 anni
18.93
-0.899
-4.53%
1 gen 2005 anni
15.517
-3.413
-18.03%
1 gen 2006 anni
17.231
+1.714
11.05%
1 gen 2007 anni
11.897
-5.334
-30.96%
1 gen 2008 anni
12.721
+0.824
6.92%
1 gen 2009 anni
12.866
+0.145
1.14%
1 gen 2010 anni
12.072
-0.794
-6.17%
1 gen 2011 anni
11.973
-0.099
-0.82%
1 gen 2012 anni
7.239
-4.734
-39.54%
1 gen 2013 anni
9.562
+2.324
32.1%
1 gen 2014 anni
9.179
-0.383
-4.01%
Classificazione dei paesi secondo i statistiche attuali per anni


Commenti: