29
/it/
it
AIzaSyAYiBZKx7MnpbEhh9jyipgxe19OcubqV5w
April 1, 2024
196353
Mexico
MEX
true
2
1
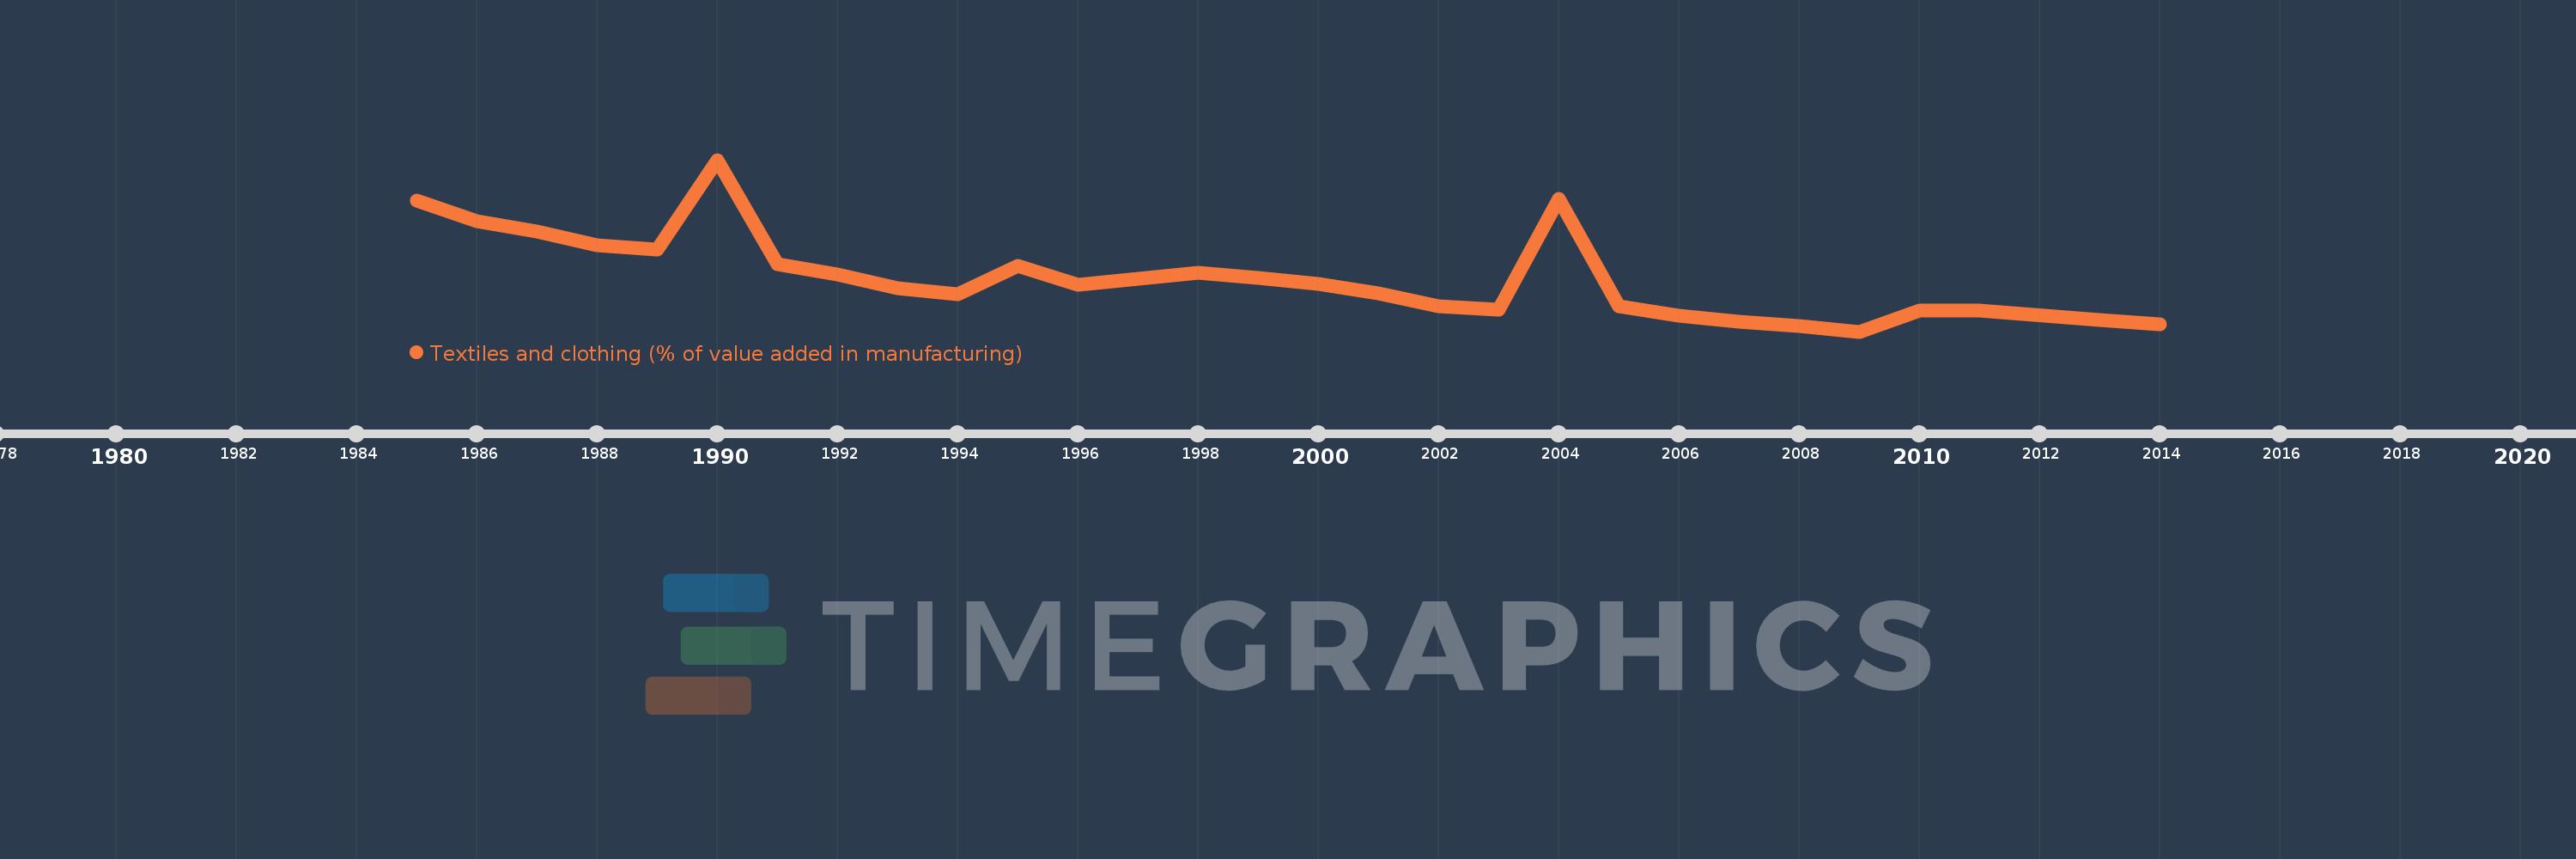
Textiles and clothing (% of value added in manufacturing)
2014,2013,2011,2010,2009,2008,2007,2006,2005,2004,2003,2002,2001,2000,1999,1998,1997,1996,1995,1994,1993,1992,1991,1990,1989,1988,1987,1986,1985
Queste statistiche in altri paesi:
AlbaniaAlgeriaArgentinaAustraliaAustriaAzerbaijanBahamas, TheBahrainBangladeshBarbadosBelarusBelgiumBelizeBeninBoliviaBosnia and HerzegovinaBotswanaBrazilBulgariaBurkina FasoBurundiCambodiaCameroonCanadaCentral African RepublicChileChinaColombiaCongo, Rep.Costa RicaCote d'IvoireCroatiaCubaCyprusCzech RepublicDenmarkDominican RepublicEcuadorEgypt, Arab Rep.El SalvadorEritreaEstoniaEthiopiaFijiFinlandFranceGabonGambia, TheGeorgiaGermanyGhanaGreeceGuatemalaHondurasHong Kong SAR, ChinaHungaryIcelandIndiaIndonesiaIran, Islamic Rep.IraqIrelandIsraelItalyJamaicaJapanJordanKazakhstanKenyaKorea, Rep.KuwaitKyrgyz RepublicLao PDRLatviaLebanonLesothoLibyaLithuaniaLuxembourgMacao SAR, ChinaMacedonia, FYRMadagascarMalawiMalaysiaMaltaMauritiusMexicoMoldovaMongoliaMoroccoMozambiqueNamibiaNepalNetherlandsNew ZealandNicaraguaNigerNigeriaNorwayOmanPakistanPanamaPapua New GuineaParaguayPeruPhilippinesPolandPortugalPuerto RicoQatarRomaniaRussian FederationRwandaSaudi ArabiaSenegalSerbiaSierra LeoneSingaporeSlovak RepublicSloveniaSomaliaSouth AfricaSpainSri LankaSt. LuciaSudanSwazilandSwedenSwitzerlandSyrian Arab RepublicTanzaniaThailandTongaTrinidad and TobagoTunisiaTurkeyUgandaUkraineUnited Arab EmiratesUnited KingdomUnited StatesUruguayVenezuela, RBVietnamWest Bank and GazaYemen, Rep.Zambia Linea del tempo:
Questa scala temporale mostra un grafico dal 1985 anno al 2014 anno. Mexico. I dati fino ad 1984 anno non disponibili. Il numero di osservazioni attuali secondo i date: 29.
La fonte (nome):
Indicatori dello sviluppo mondiale
La fonte (organizzazione):
United Nations Industrial Development Organization, International Yearbook of Industrial Statistics.
Categorie:
Economy & Growth
sono stati aggiornati
23 apr 2017 anni
Indicatori delle variazioni dei valori per anni
Minima:
2.756
1 gen 2009 anni
Massimo:
7.984
1 gen 1990 anni
Alla data di osservazione
Valore
Variazione assoluta
La variazione rispetto al valore precedente
1 gen 1985 anni
6.738
+6.738
0.0%
1 gen 1986 anni
6.114
-0.625
-9.27%
1 gen 1987 anni
5.798
-0.316
-5.17%
1 gen 1988 anni
5.374
-0.424
-7.31%
1 gen 1989 anni
5.252
-0.122
-2.27%
1 gen 1990 anni
7.984
+2.732
52.01%
1 gen 1991 anni
4.8
-3.183
-39.88%
1 gen 1992 anni
4.499
-0.301
-6.27%
1 gen 1993 anni
4.084
-0.415
-9.22%
1 gen 1994 anni
3.897
-0.187
-4.57%
1 gen 1995 anni
4.763
+0.866
22.21%
1 gen 1996 anni
4.172
-0.591
-12.41%
1 gen 1997 anni
4.357
+0.185
4.43%
1 gen 1998 anni
4.55
+0.193
4.43%
1 gen 1999 anni
4.387
-0.163
-3.57%
1 gen 2000 anni
4.214
-0.174
-3.96%
1 gen 2001 anni
3.925
-0.289
-6.85%
1 gen 2002 anni
3.523
-0.402
-10.25%
1 gen 2003 anni
3.417
-0.106
-3.01%
1 gen 2004 anni
6.795
+3.378
98.87%
1 gen 2005 anni
3.539
-3.256
-47.92%
1 gen 2006 anni
3.243
-0.296
-8.36%
1 gen 2007 anni
3.056
-0.188
-5.79%
1 gen 2008 anni
2.92
-0.136
-4.44%
1 gen 2009 anni
2.756
-0.164
-5.61%
1 gen 2010 anni
3.397
+0.64
23.22%
1 gen 2011 anni
3.39
-0.006
-0.19%
1 gen 2013 anni
3.105
-0.285
-8.41%
1 gen 2014 anni
2.97
-0.135
-4.34%
Classificazione dei paesi secondo i statistiche attuali per anni


Commenti: