29
/it/
it
AIzaSyAYiBZKx7MnpbEhh9jyipgxe19OcubqV5w
April 1, 2024
215870
Oman
OMN
true
2
1
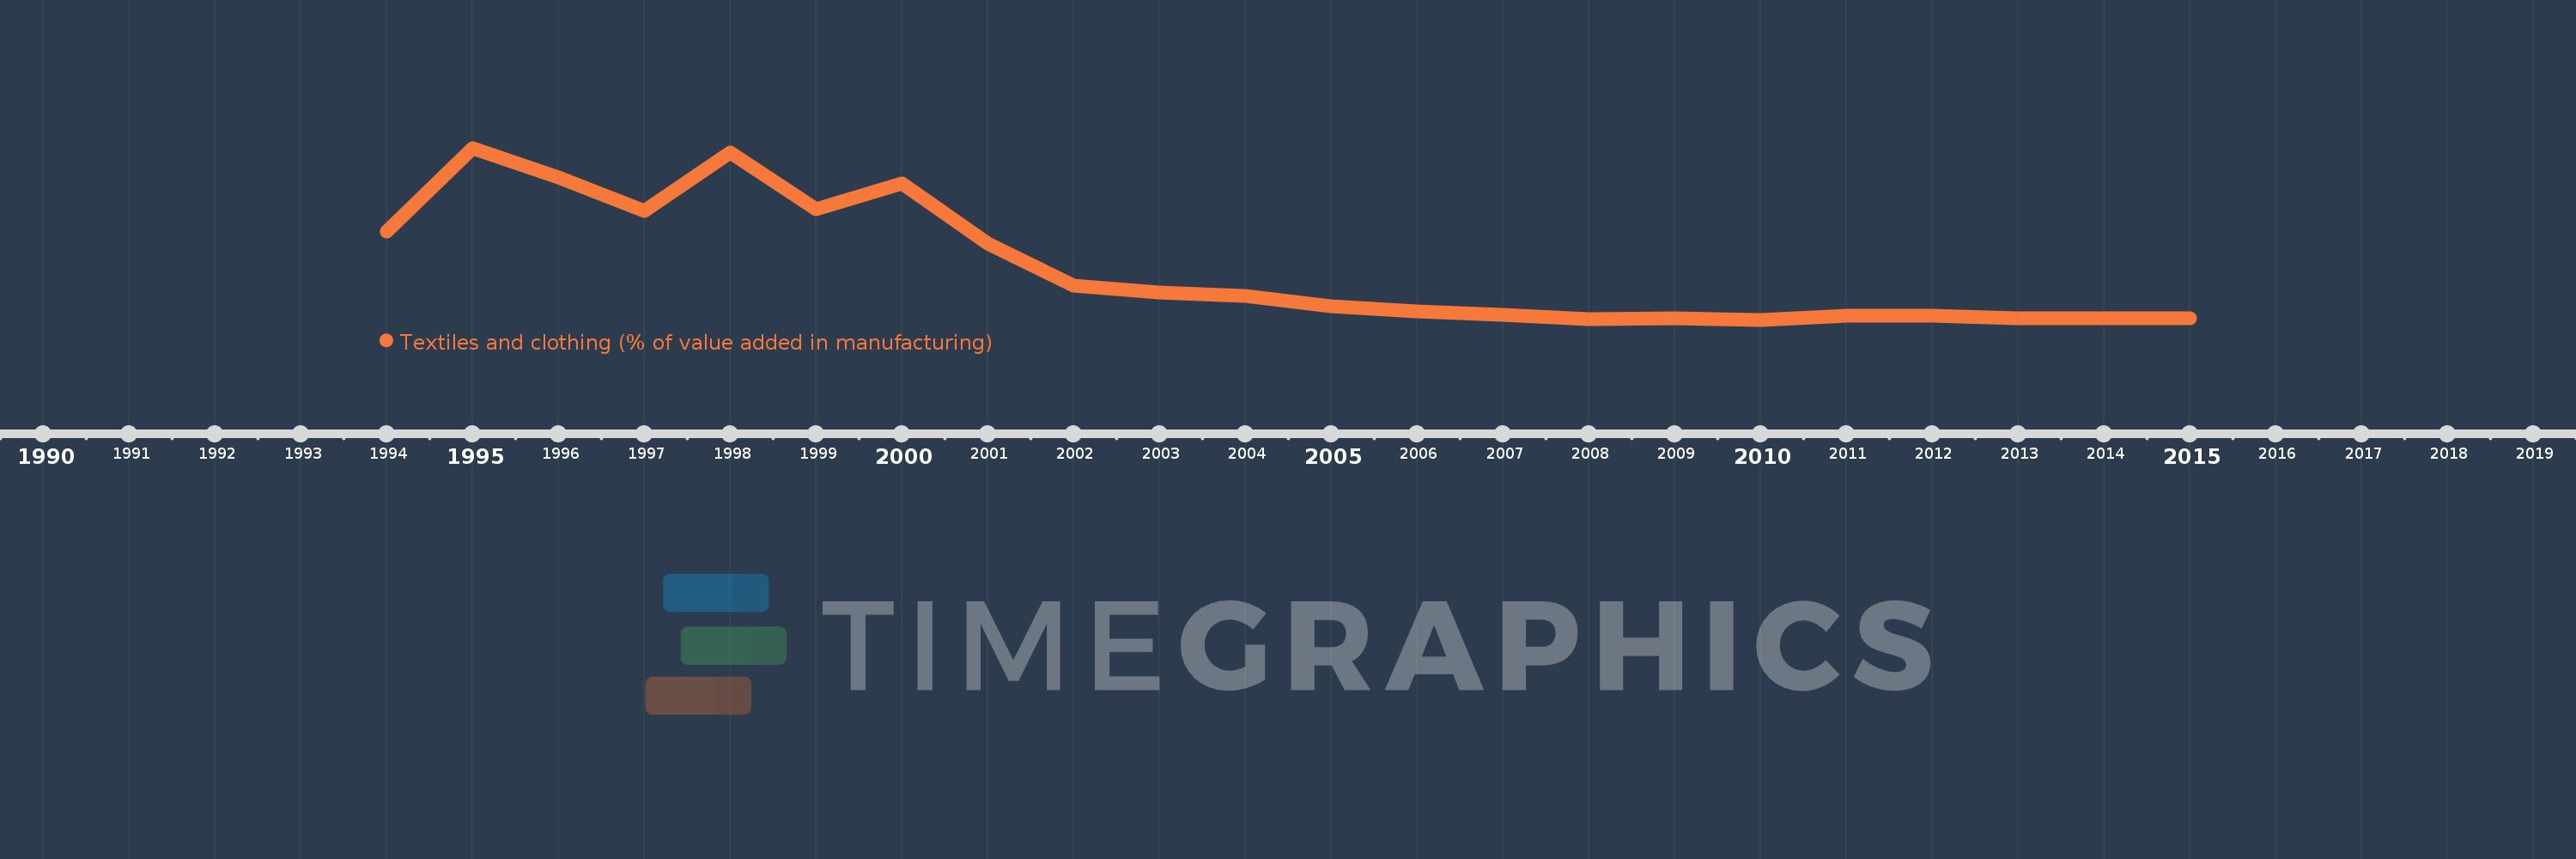
Textiles and clothing (% of value added in manufacturing)
2015,2014,2013,2012,2011,2010,2009,2008,2007,2006,2005,2004,2003,2002,2001,2000,1999,1998,1997,1996,1995,1994
Queste statistiche in altri paesi:
AlbaniaAlgeriaArgentinaAustraliaAustriaAzerbaijanBahamas, TheBahrainBangladeshBarbadosBelarusBelgiumBelizeBeninBoliviaBosnia and HerzegovinaBotswanaBrazilBulgariaBurkina FasoBurundiCambodiaCameroonCanadaCentral African RepublicChileChinaColombiaCongo, Rep.Costa RicaCote d'IvoireCroatiaCubaCyprusCzech RepublicDenmarkDominican RepublicEcuadorEgypt, Arab Rep.El SalvadorEritreaEstoniaEthiopiaFijiFinlandFranceGabonGambia, TheGeorgiaGermanyGhanaGreeceGuatemalaHondurasHong Kong SAR, ChinaHungaryIcelandIndiaIndonesiaIran, Islamic Rep.IraqIrelandIsraelItalyJamaicaJapanJordanKazakhstanKenyaKorea, Rep.KuwaitKyrgyz RepublicLao PDRLatviaLebanonLesothoLibyaLithuaniaLuxembourgMacao SAR, ChinaMacedonia, FYRMadagascarMalawiMalaysiaMaltaMauritiusMexicoMoldovaMongoliaMoroccoMozambiqueNamibiaNepalNetherlandsNew ZealandNicaraguaNigerNigeriaNorwayOmanPakistanPanamaPapua New GuineaParaguayPeruPhilippinesPolandPortugalPuerto RicoQatarRomaniaRussian FederationRwandaSaudi ArabiaSenegalSerbiaSierra LeoneSingaporeSlovak RepublicSloveniaSomaliaSouth AfricaSpainSri LankaSt. LuciaSudanSwazilandSwedenSwitzerlandSyrian Arab RepublicTanzaniaThailandTongaTrinidad and TobagoTunisiaTurkeyUgandaUkraineUnited Arab EmiratesUnited KingdomUnited StatesUruguayVenezuela, RBVietnamWest Bank and GazaYemen, Rep.Zambia Linea del tempo:
Questa scala temporale mostra un grafico dal 1994 anno al 2015 anno. Oman. I dati fino ad 1993 anno non disponibili. Il numero di osservazioni attuali secondo i date: 22.
La fonte (nome):
Indicatori dello sviluppo mondiale
La fonte (organizzazione):
United Nations Industrial Development Organization, International Yearbook of Industrial Statistics.
Categorie:
Economy & Growth
sono stati aggiornati
23 apr 2017 anni
Indicatori delle variazioni dei valori per anni
Minima:
0.225
1 gen 2010 anni
Massimo:
10.072
1 gen 1995 anni
Alla data di osservazione
Valore
Variazione assoluta
La variazione rispetto al valore precedente
1 gen 1994 anni
5.299
+5.299
0.0%
1 gen 1995 anni
10.072
+4.774
90.08%
1 gen 1996 anni
8.38
-1.692
-16.8%
1 gen 1997 anni
6.446
-1.935
-23.08%
1 gen 1998 anni
9.812
+3.366
52.22%
1 gen 1999 anni
6.564
-3.248
-33.1%
1 gen 2000 anni
8.025
+1.461
22.26%
1 gen 2001 anni
4.613
-3.413
-42.52%
1 gen 2002 anni
2.179
-2.433
-52.75%
1 gen 2003 anni
1.8
-0.379
-17.41%
1 gen 2004 anni
1.59
-0.21
-11.64%
1 gen 2005 anni
1.003
-0.587
-36.92%
1 gen 2006 anni
0.713
-0.29
-28.93%
1 gen 2007 anni
0.495
-0.218
-30.51%
1 gen 2008 anni
0.273
-0.222
-44.86%
1 gen 2009 anni
0.295
+0.022
7.91%
1 gen 2010 anni
0.225
-0.07
-23.66%
1 gen 2011 anni
0.44
+0.215
95.73%
1 gen 2012 anni
0.457
+0.017
3.8%
1 gen 2013 anni
0.325
-0.132
-28.91%
1 gen 2014 anni
0.325
0.0
0.0%
1 gen 2015 anni
0.325
0.0
0.0%
Classificazione dei paesi secondo i statistiche attuali per anni


Commenti: