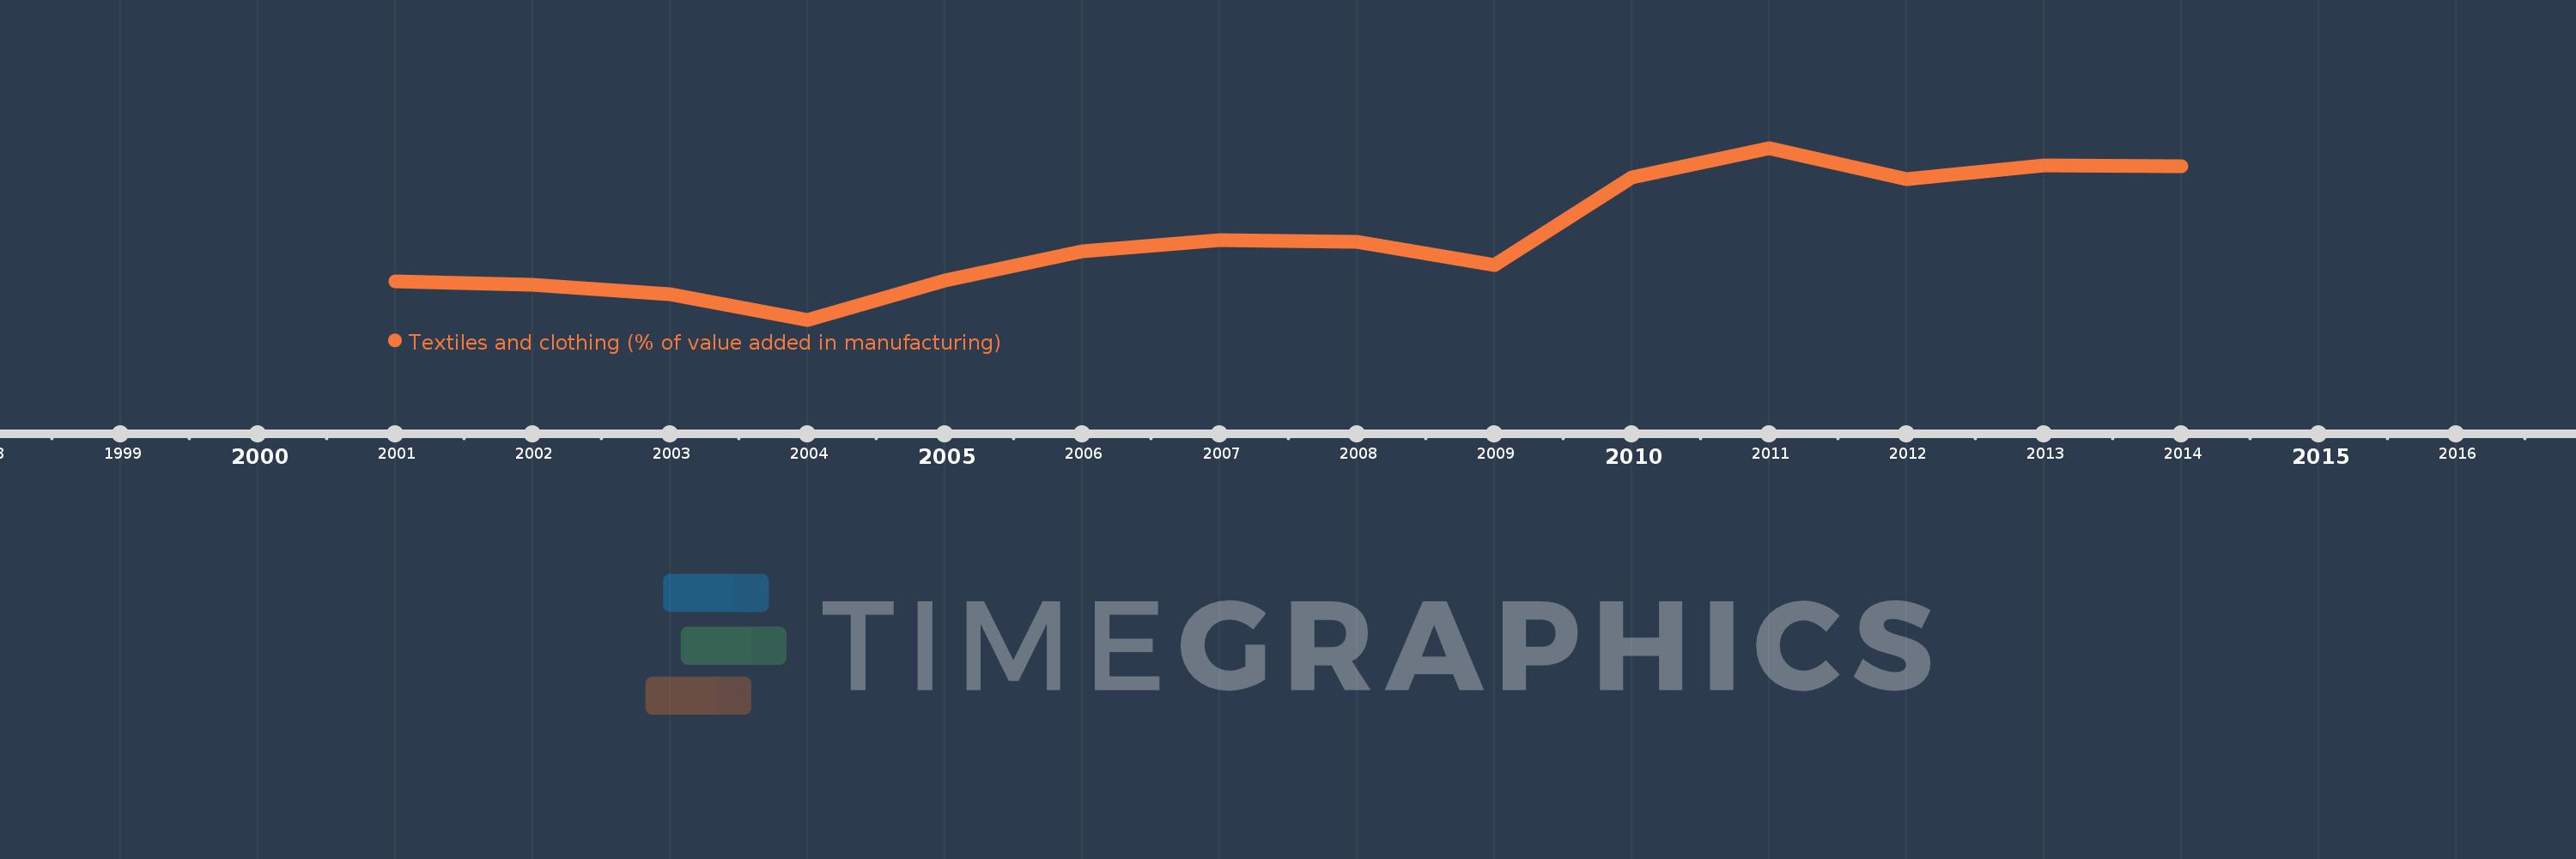
Questa scala temporale mostra un grafico dal 2001 anno al 2014 anno. Georgia. I dati fino ad 2000 anno non disponibili. Il numero di osservazioni attuali secondo i date: 14.
La fonte (nome):
Indicatori dello sviluppo mondiale
La fonte (organizzazione):
United Nations Industrial Development Organization, International Yearbook of Industrial Statistics.
Categorie:
Economy & Growth
sono stati aggiornati
23 apr 2017 anni
Indicatori delle variazioni dei valori per anni
In media:
1.757
Minima:
0.708
1 gen 2004 anni
Massimo:
2.843
1 gen 2011 anni
Alla data di osservazione
Valore
Variazione assoluta
La variazione rispetto al valore precedente
1 gen 2001 anni
1.183
+1.183
0.0%
1 gen 2002 anni
1.138
-0.045
-3.82%
1 gen 2003 anni
1.021
-0.117
-10.24%
1 gen 2004 anni
0.708
-0.313
-30.69%
1 gen 2005 anni
1.197
+0.489
69.12%
1 gen 2006 anni
1.557
+0.36
30.03%
1 gen 2007 anni
1.702
+0.146
9.35%
1 gen 2008 anni
1.673
-0.029
-1.72%
1 gen 2009 anni
1.392
-0.281
-16.78%
1 gen 2010 anni
2.479
+1.087
78.11%
1 gen 2011 anni
2.843
+0.364
14.67%
1 gen 2012 anni
2.453
-0.39
-13.72%
1 gen 2013 anni
2.628
+0.175
7.13%
1 gen 2014 anni
2.619
-0.009
-0.33%
Classificazione dei paesi secondo i statistiche attuali per anni
