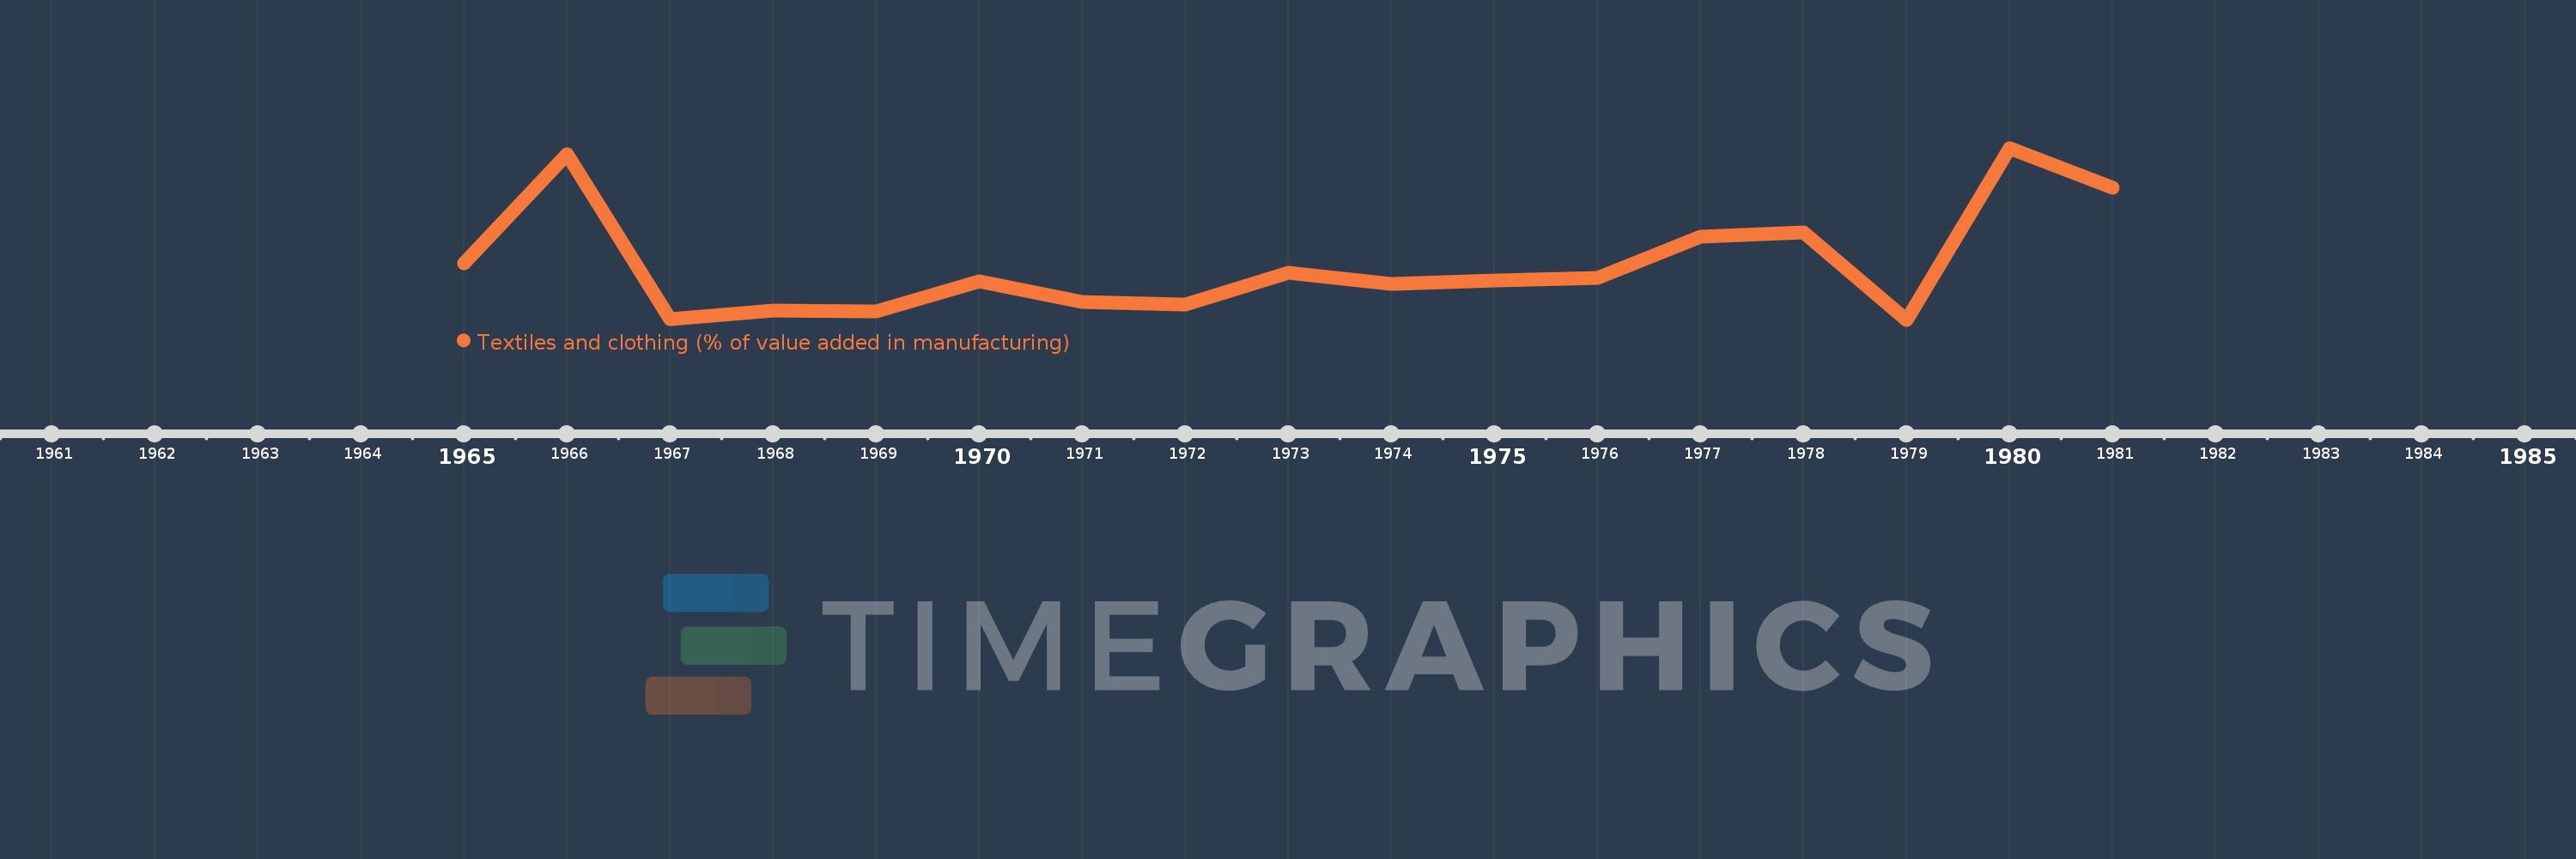
Questa scala temporale mostra un grafico dal 1965 anno al 1981 anno. Libya. I dati fino ad 1964 anno non disponibili. Il numero di osservazioni attuali secondo i date: 17.
La fonte (nome):
Indicatori dello sviluppo mondiale
La fonte (organizzazione):
United Nations Industrial Development Organization, International Yearbook of Industrial Statistics.
Categorie:
Economy & Growth
sono stati aggiornati
23 apr 2017 anni
Indicatori delle variazioni dei valori per anni
In media:
6.375
Minima:
3.71
1 gen 1979 anni
Massimo:
11.911
1 gen 1980 anni
Alla data di osservazione
Valore
Variazione assoluta
La variazione rispetto al valore precedente
1 gen 1965 anni
6.418
+6.418
0.0%
1 gen 1966 anni
11.601
+5.182
80.74%
1 gen 1967 anni
3.737
-7.863
-67.78%
1 gen 1968 anni
4.144
+0.407
10.89%
1 gen 1969 anni
4.103
-0.042
-1.0%
1 gen 1970 anni
5.524
+1.421
34.64%
1 gen 1971 anni
4.547
-0.977
-17.68%
1 gen 1972 anni
4.439
-0.108
-2.38%
1 gen 1973 anni
5.934
+1.494
33.67%
1 gen 1974 anni
5.435
-0.499
-8.4%
1 gen 1975 anni
5.564
+0.129
2.37%
1 gen 1976 anni
5.725
+0.162
2.91%
1 gen 1977 anni
7.679
+1.954
34.12%
1 gen 1978 anni
7.884
+0.205
2.66%
1 gen 1979 anni
3.71
-4.174
-52.95%
1 gen 1980 anni
11.911
+8.201
221.08%
1 gen 1981 anni
10.025
-1.885
-15.83%
Classificazione dei paesi secondo i statistiche attuali per anni
