29
/it/
it
AIzaSyAYiBZKx7MnpbEhh9jyipgxe19OcubqV5w
April 1, 2024
212713
Nigeria
NGA
true
2
1
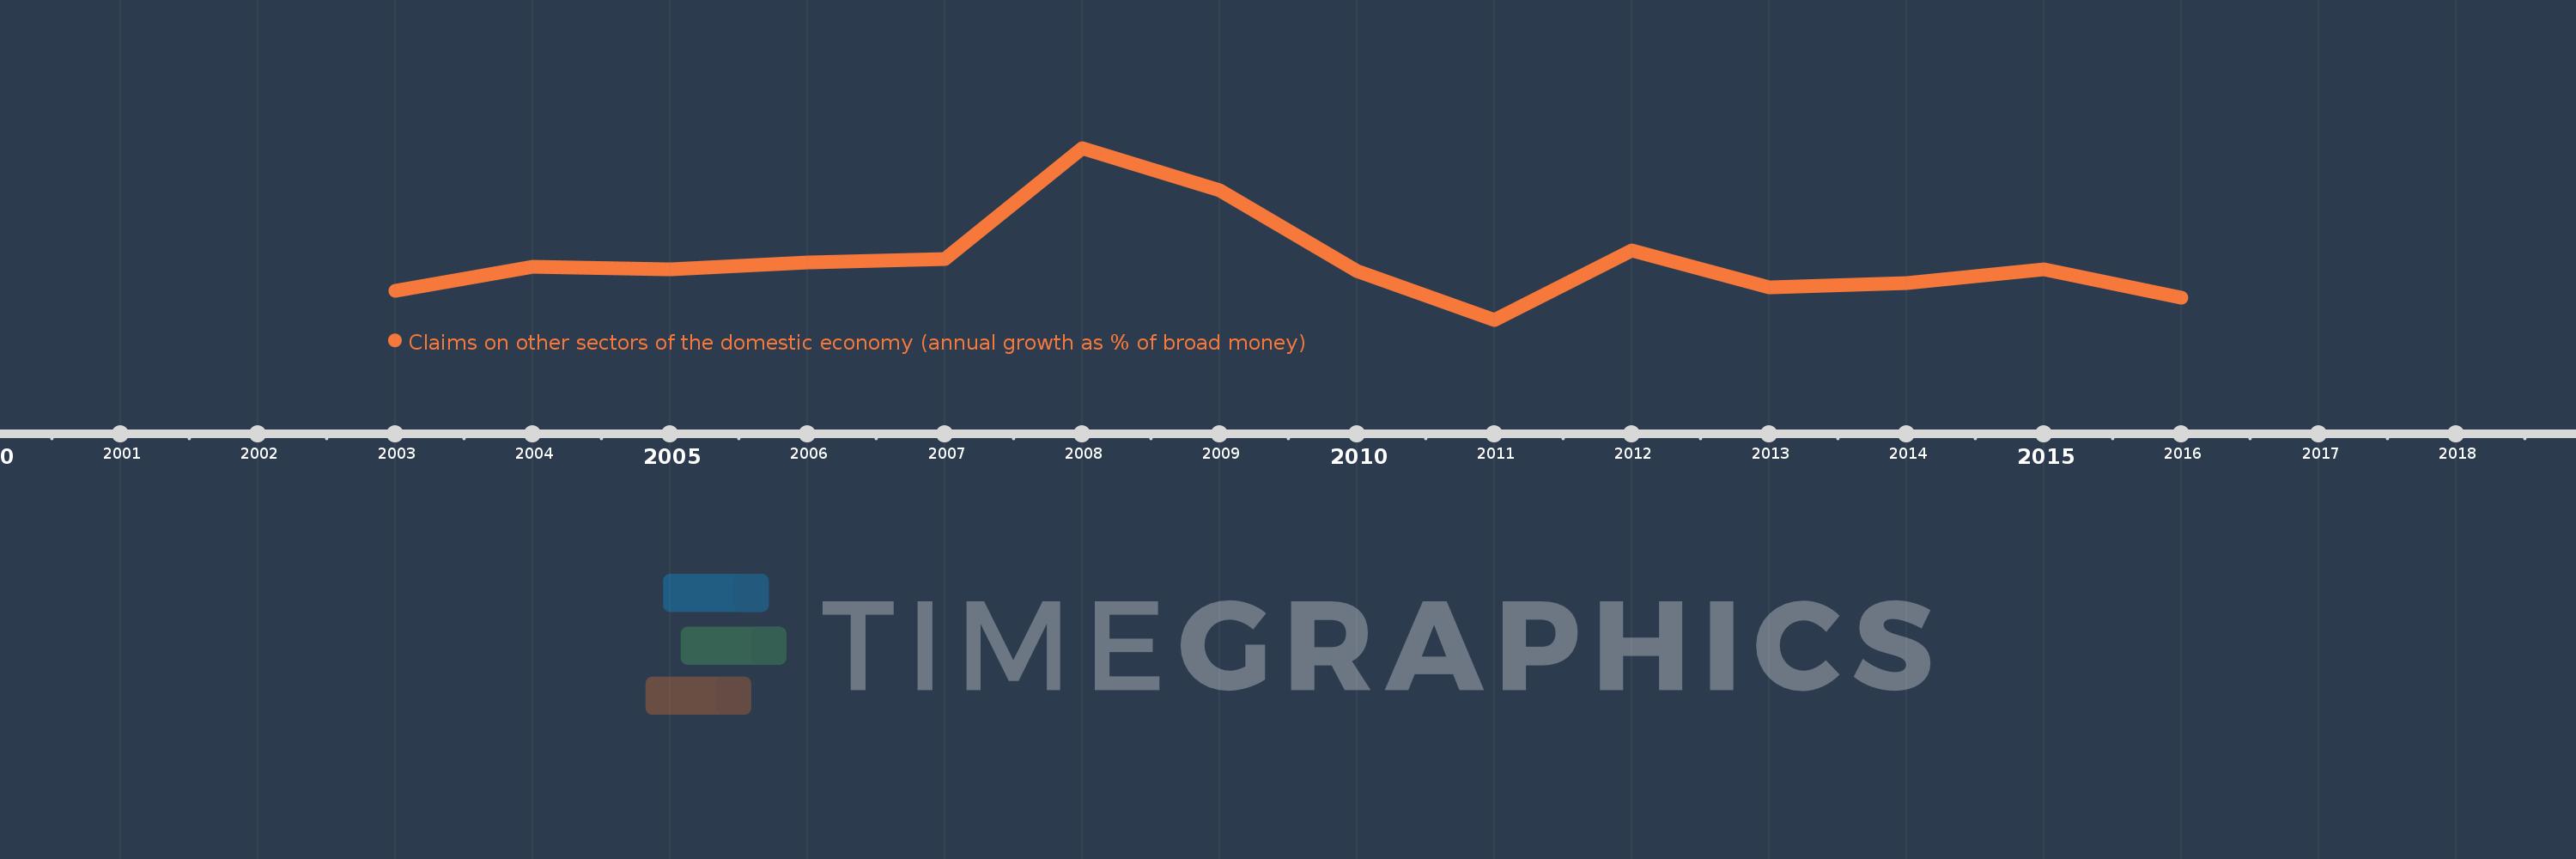
Claims on other sectors of the domestic economy (annual growth as % of broad money)
2016,2015,2014,2013,2012,2011,2010,2009,2008,2007,2006,2005,2004,2003
Queste statistiche in altri paesi:
Linea del tempo:
Questa scala temporale mostra un grafico dal 2003 anno al 2016 anno. Nigeria. I dati fino ad 2002 anno non disponibili. Il numero di osservazioni attuali secondo i date: 14.
La fonte (nome):
Indicatori dello sviluppo mondiale
La fonte (organizzazione):
International Monetary Fund, International Financial Statistics and data files.
Categorie:
Financial Sector
sono stati aggiornati
23 apr 2017 anni
Indicatori delle variazioni dei valori per anni
Minima:
-11.248
1 gen 2011 anni
Massimo:
88.298
1 gen 2008 anni
Alla data di osservazione
Valore
Variazione assoluta
La variazione rispetto al valore precedente
1 gen 2003 anni
5.751
+5.751
0.0%
1 gen 2004 anni
19.54
+13.79
239.79%
1 gen 2005 anni
17.753
-1.787
-9.15%
1 gen 2006 anni
21.88
+4.127
23.25%
1 gen 2007 anni
23.955
+2.075
9.48%
1 gen 2008 anni
88.298
+64.343
268.6%
1 gen 2009 anni
63.917
-24.381
-27.61%
1 gen 2010 anni
16.921
-46.996
-73.53%
1 gen 2011 anni
-11.248
-28.169
-166.47%
1 gen 2012 anni
29.002
+40.25
-357.85%
1 gen 2013 anni
7.437
-21.565
-74.36%
1 gen 2014 anni
9.887
+2.45
32.94%
1 gen 2015 anni
17.799
+7.913
80.03%
1 gen 2016 anni
1.671
-16.128
-90.61%
Classificazione dei paesi secondo i statistiche attuali per anni


Commenti: