29
/it/
it
AIzaSyAYiBZKx7MnpbEhh9jyipgxe19OcubqV5w
April 1, 2024
271988
Uganda
UGA
true
2
1
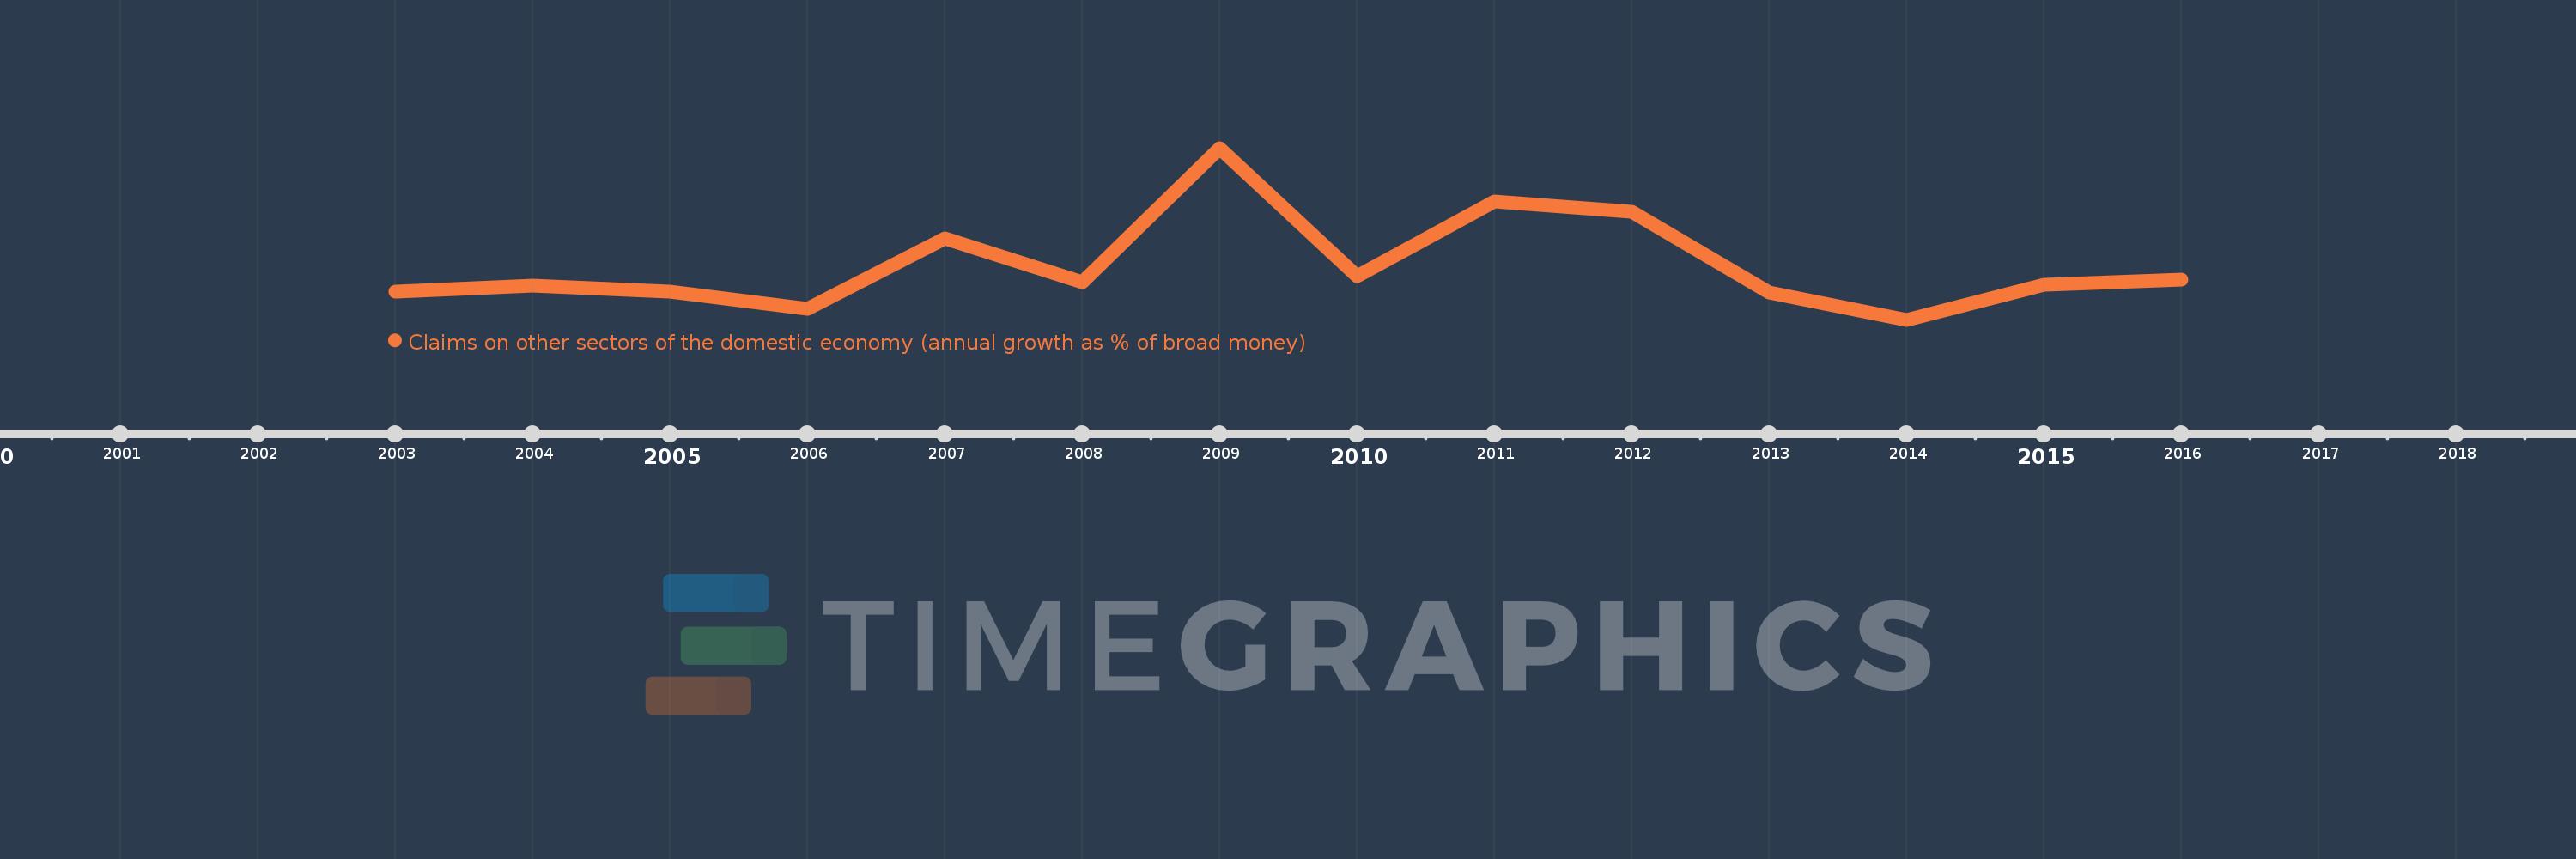
Claims on other sectors of the domestic economy (annual growth as % of broad money)
2016,2015,2014,2013,2012,2011,2010,2009,2008,2007,2006,2005,2004,2003
Queste statistiche in altri paesi:
Linea del tempo:
Questa scala temporale mostra un grafico dal 2003 anno al 2016 anno. Uganda. I dati fino ad 2002 anno non disponibili. Il numero di osservazioni attuali secondo i date: 14.
La fonte (nome):
Indicatori dello sviluppo mondiale
La fonte (organizzazione):
International Monetary Fund, International Financial Statistics and data files.
Categorie:
Financial Sector
sono stati aggiornati
23 apr 2017 anni
Indicatori delle variazioni dei valori per anni
Minima:
4.229
1 gen 2014 anni
Massimo:
28.246
1 gen 2009 anni
Alla data di osservazione
Valore
Variazione assoluta
La variazione rispetto al valore precedente
1 gen 2003 anni
8.165
+8.165
0.0%
1 gen 2004 anni
9.047
+0.881
10.8%
1 gen 2005 anni
8.181
-0.866
-9.57%
1 gen 2006 anni
5.81
-2.37
-28.97%
1 gen 2007 anni
15.634
+9.823
169.06%
1 gen 2008 anni
9.481
-6.152
-39.35%
1 gen 2009 anni
28.246
+18.764
197.91%
1 gen 2010 anni
10.306
-17.939
-63.51%
1 gen 2011 anni
20.778
+10.472
101.61%
1 gen 2012 anni
19.367
-1.411
-6.79%
1 gen 2013 anni
8.055
-11.312
-58.41%
1 gen 2014 anni
4.229
-3.826
-47.5%
1 gen 2015 anni
9.138
+4.91
116.1%
1 gen 2016 anni
9.886
+0.748
8.18%
Classificazione dei paesi secondo i statistiche attuali per anni


Commenti: